Advertisement
A well-known cryptocurrency analyst has called the collapse of Bitcoin (BTC) in May 2021 a historical indicator, accurately signaling a bullish trend.
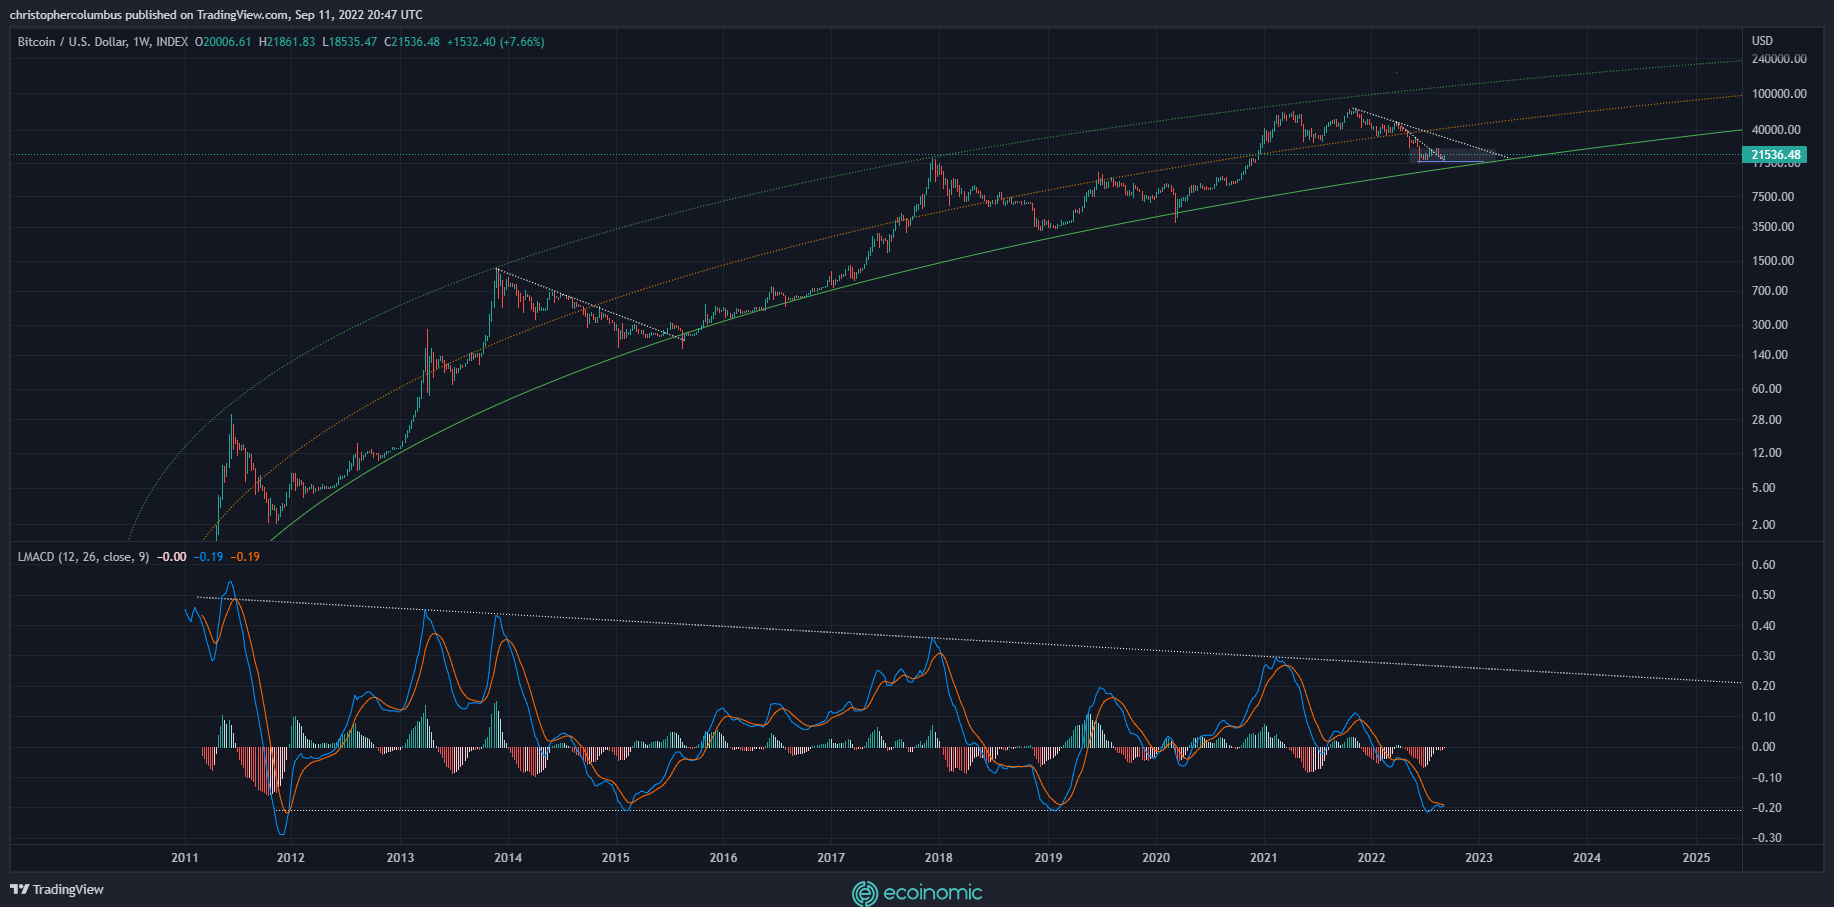
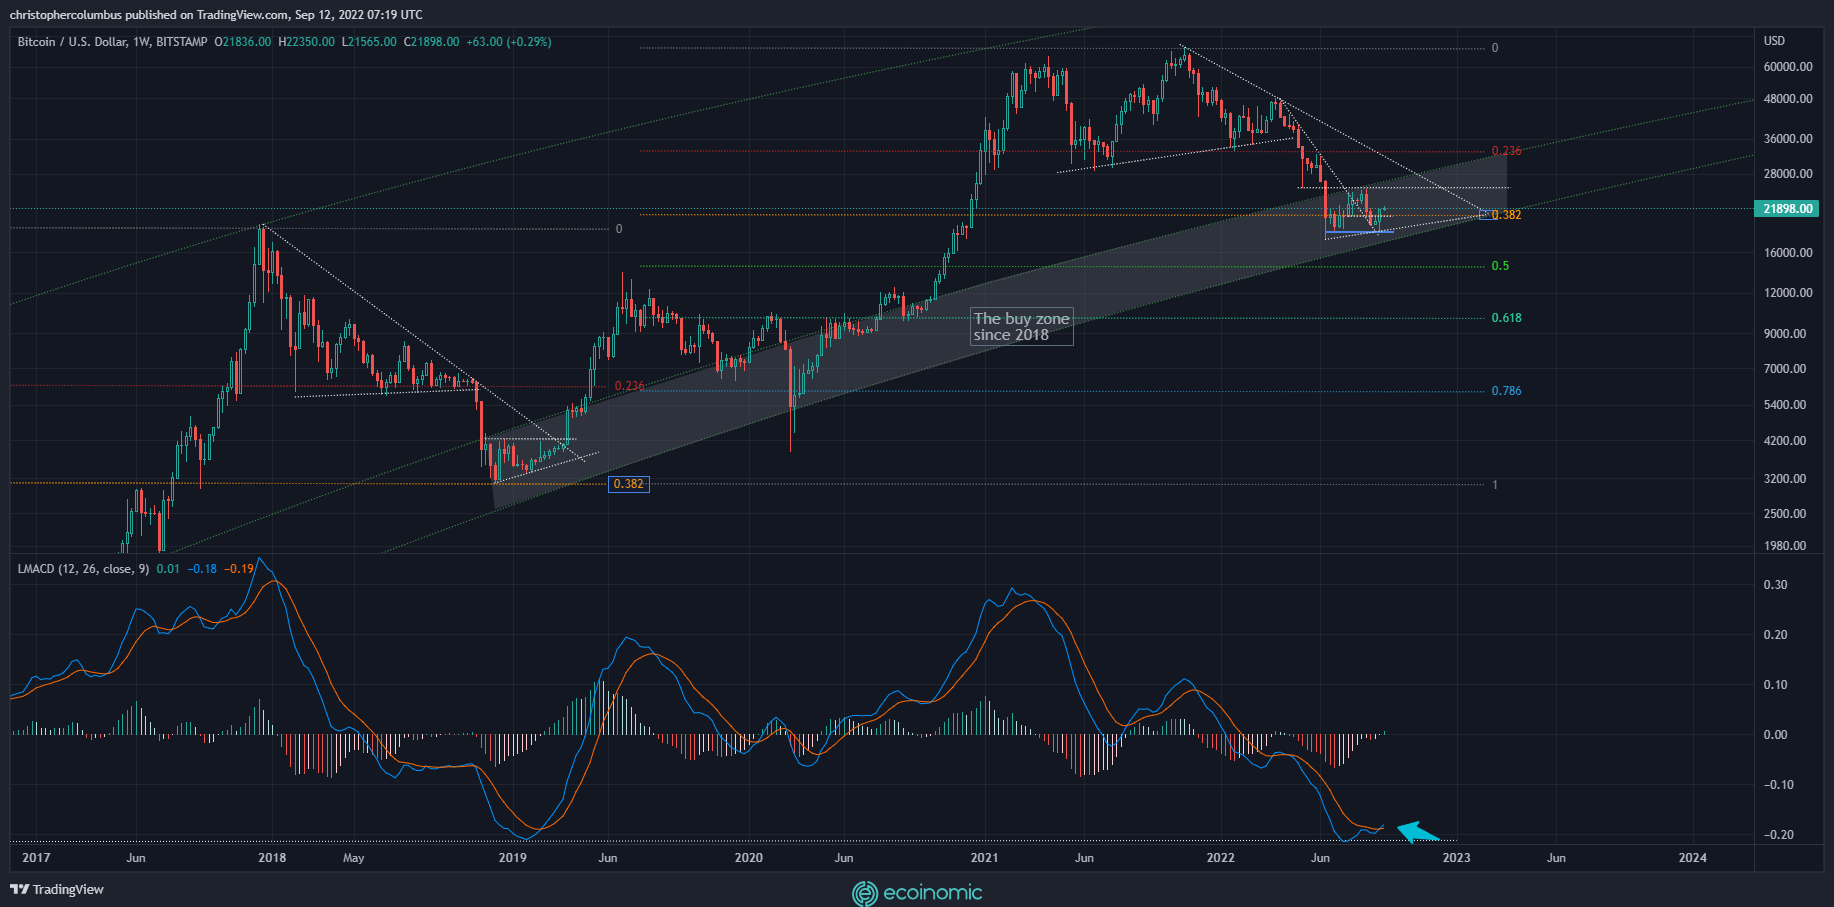
Analyst nicknamed Dave the Wave told his 125,600 Twitter followers that Bitcoin’s weekly moving average convergence (MACD) divergence has crossed below the “zero-line.”
The MACD previously crossed below that line in 2012, 2015, and 2019 ahead of huge bullish moves, according to the chart shared by the analyst.

MACD is a trend-based momentum indicator that describes the relationship between two moving averages of an asset and is used by traders to identify reversal points.
According to Dave the Wave, Bitcoin’s MACD crossing below the zero line also occurs when BTC is in an oversold position, similar to what happened in 2019.

BTC is trading at $22,364 at the time of writing. This crypto asset is top-ranked by market capitalization, up nearly 3% in the last 24 hours and more than 13% in the past seven days. Bitcoin is still down more than 67 percent from its all-time high of more than $69,000, which it reached last November.
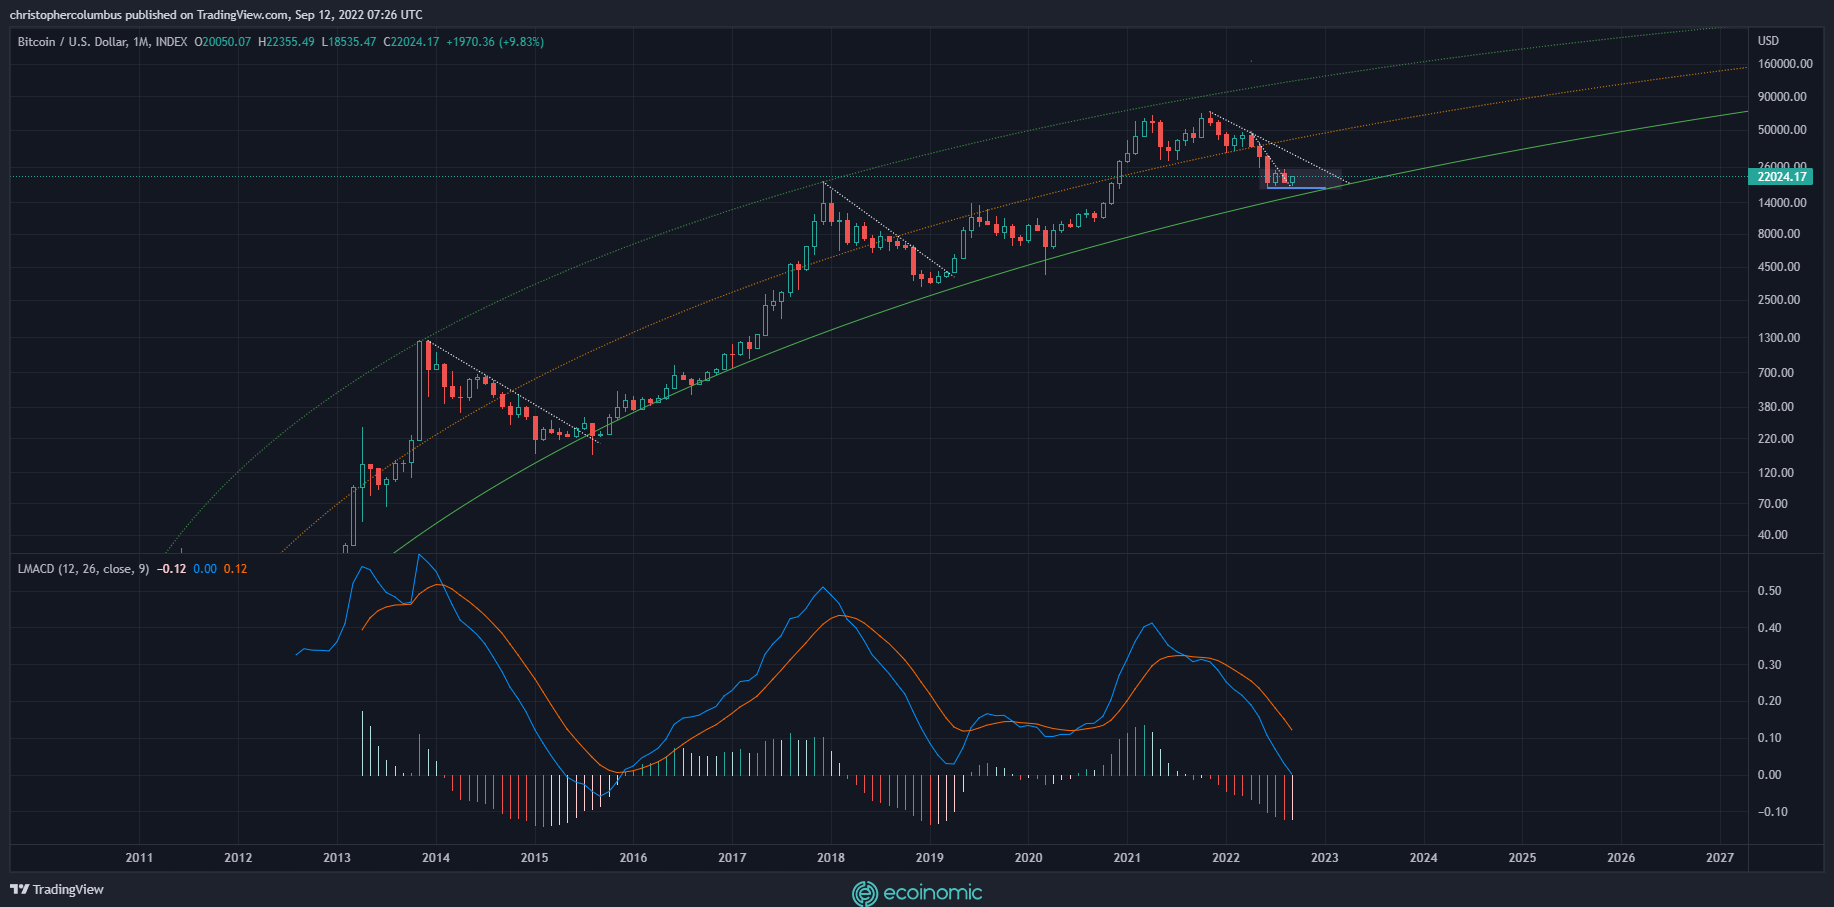
Dave the Wave also said he’s looking at the MACD on the monthly chart, which he noted is also flashing a bullish signal.


