Advertisement
Over the past few years, the cryptocurrency market has begun to have a strong correlation with the stock market. For example, in February, it was reported that the leading altcoin, Ethereum [ETH] moved more closely with U.S. stocks.
According to the report, the 40-day correlation coefficient for the token and the S&P 500 marked the position at 0.65, reaching an all-time high. In the face of growing uncertainties for the global economy, Santiment, in a new report has noticed that ETH prices continue to follow closely with the S&P500.
According to Santiment, the S&P500 retested the price zone that the market had broken earlier in intraday trading on August 25.
This breakout zone has formed a drag on this asset class. Therefore, the breakout zone must be converted into support for the bulls. With ETH following very closely with the S&P 500, Santiment noted:
“It is important that the retest levels can see a recovery to continue another bullish trend, it is highly unlikely that ETH will hold its position.”
ETH on-chain
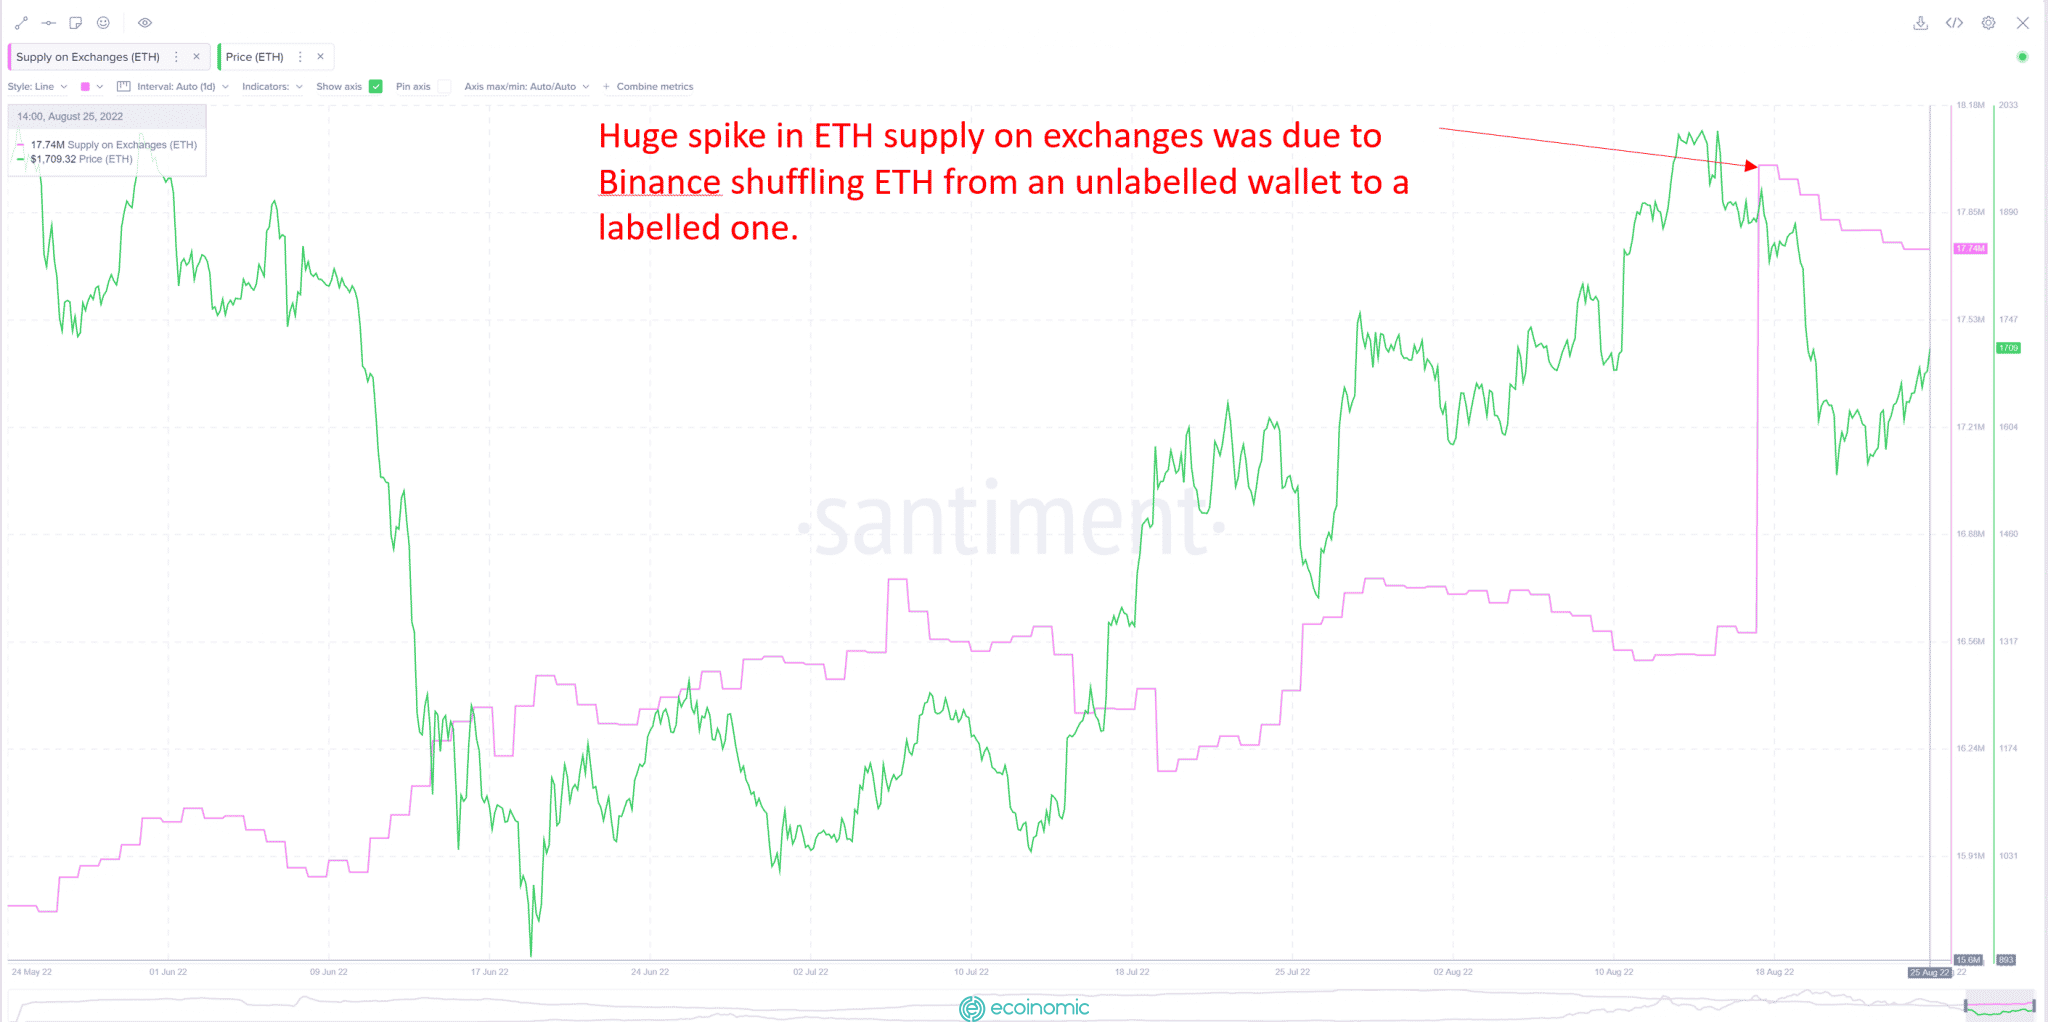
According to data from Santiment, on August 18, ETH spiked significantly in its supply on exchanges. However, the price of the leading altcoin soon fell from the $1,800 region.
According to data from Etherscan, an increase in the supply of ETH on exchanges that day led to Binance transferring 1.49 million ETH from an unknown wallet to Binance 8 wallet.

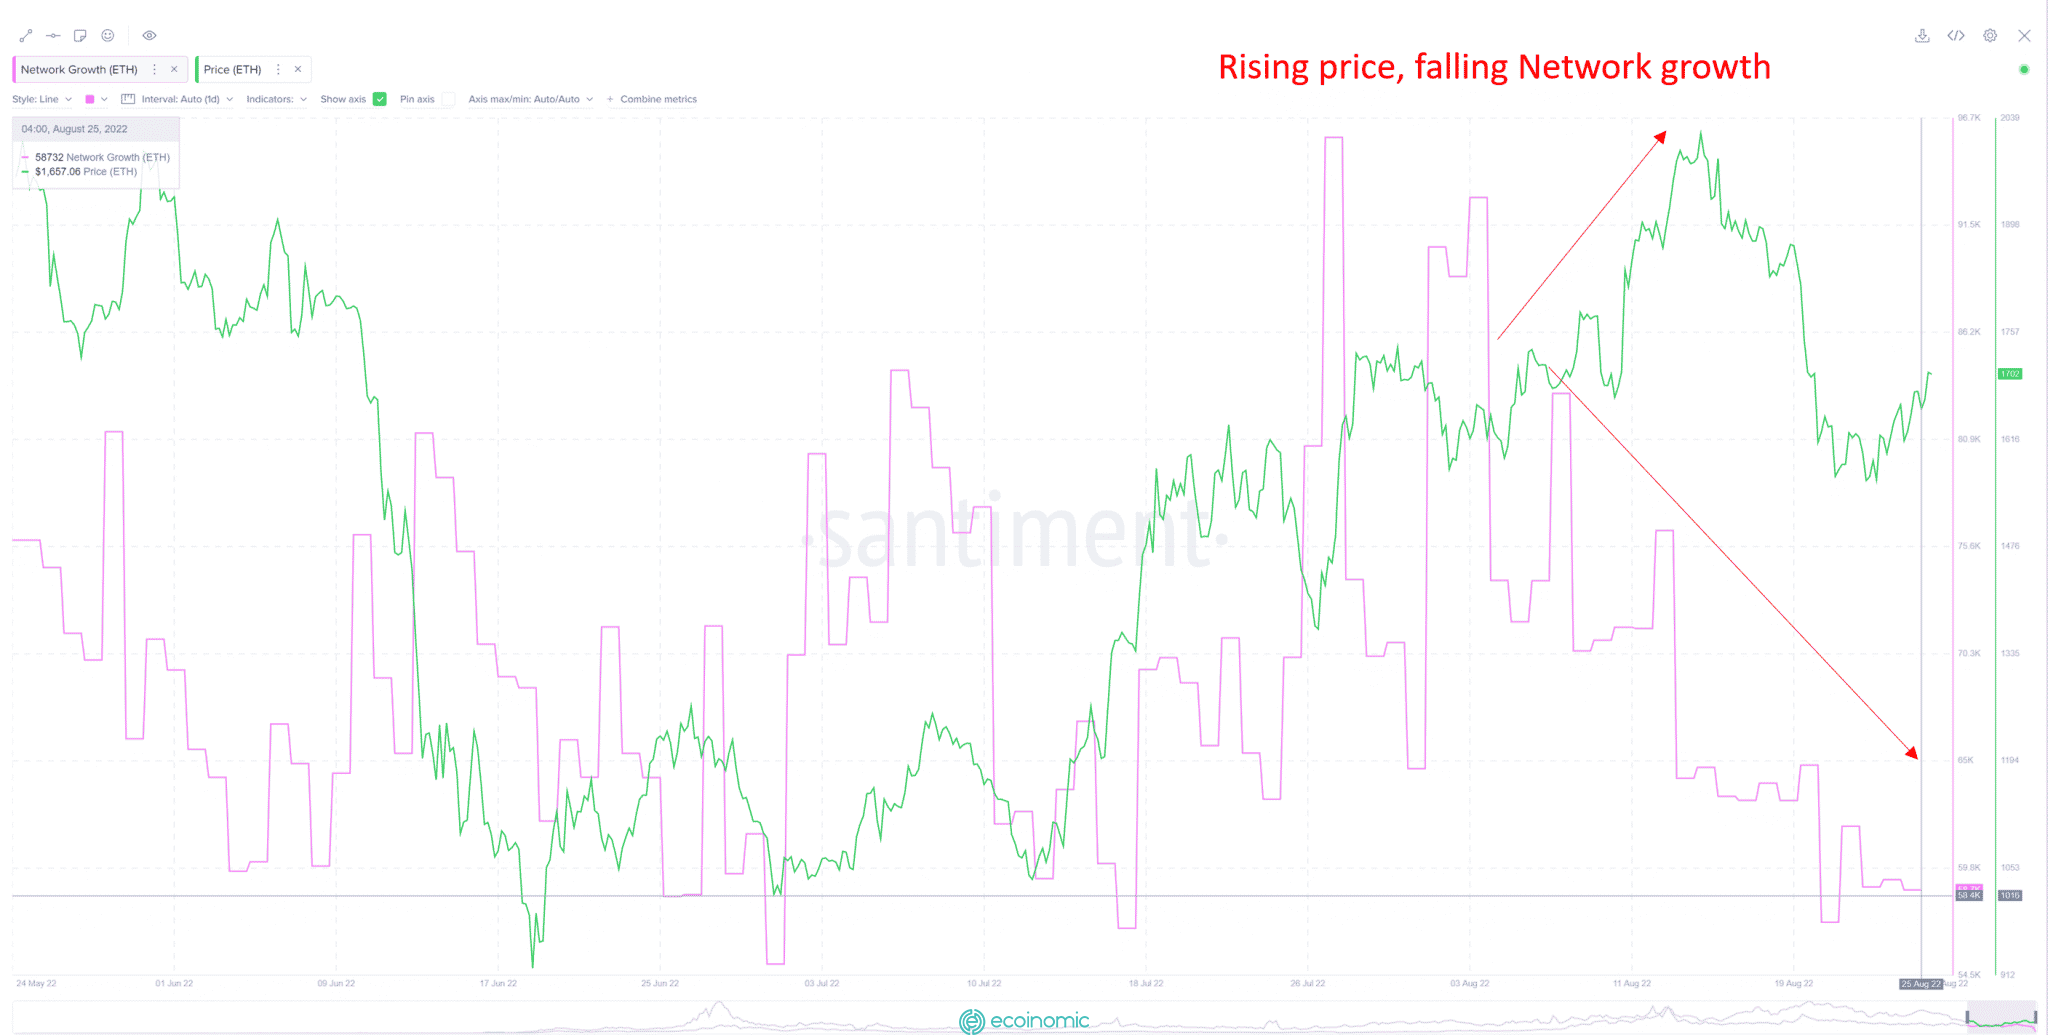
Moreover, since the beginning of August, data from Santiment shows that new addresses joining the ETH network have decreased. However, the price of altcoins continues to rise steadily.
The divergence in eth price and its network growth reveals a weak market overview. It also shows that there are few new market participants coming in to support the price.

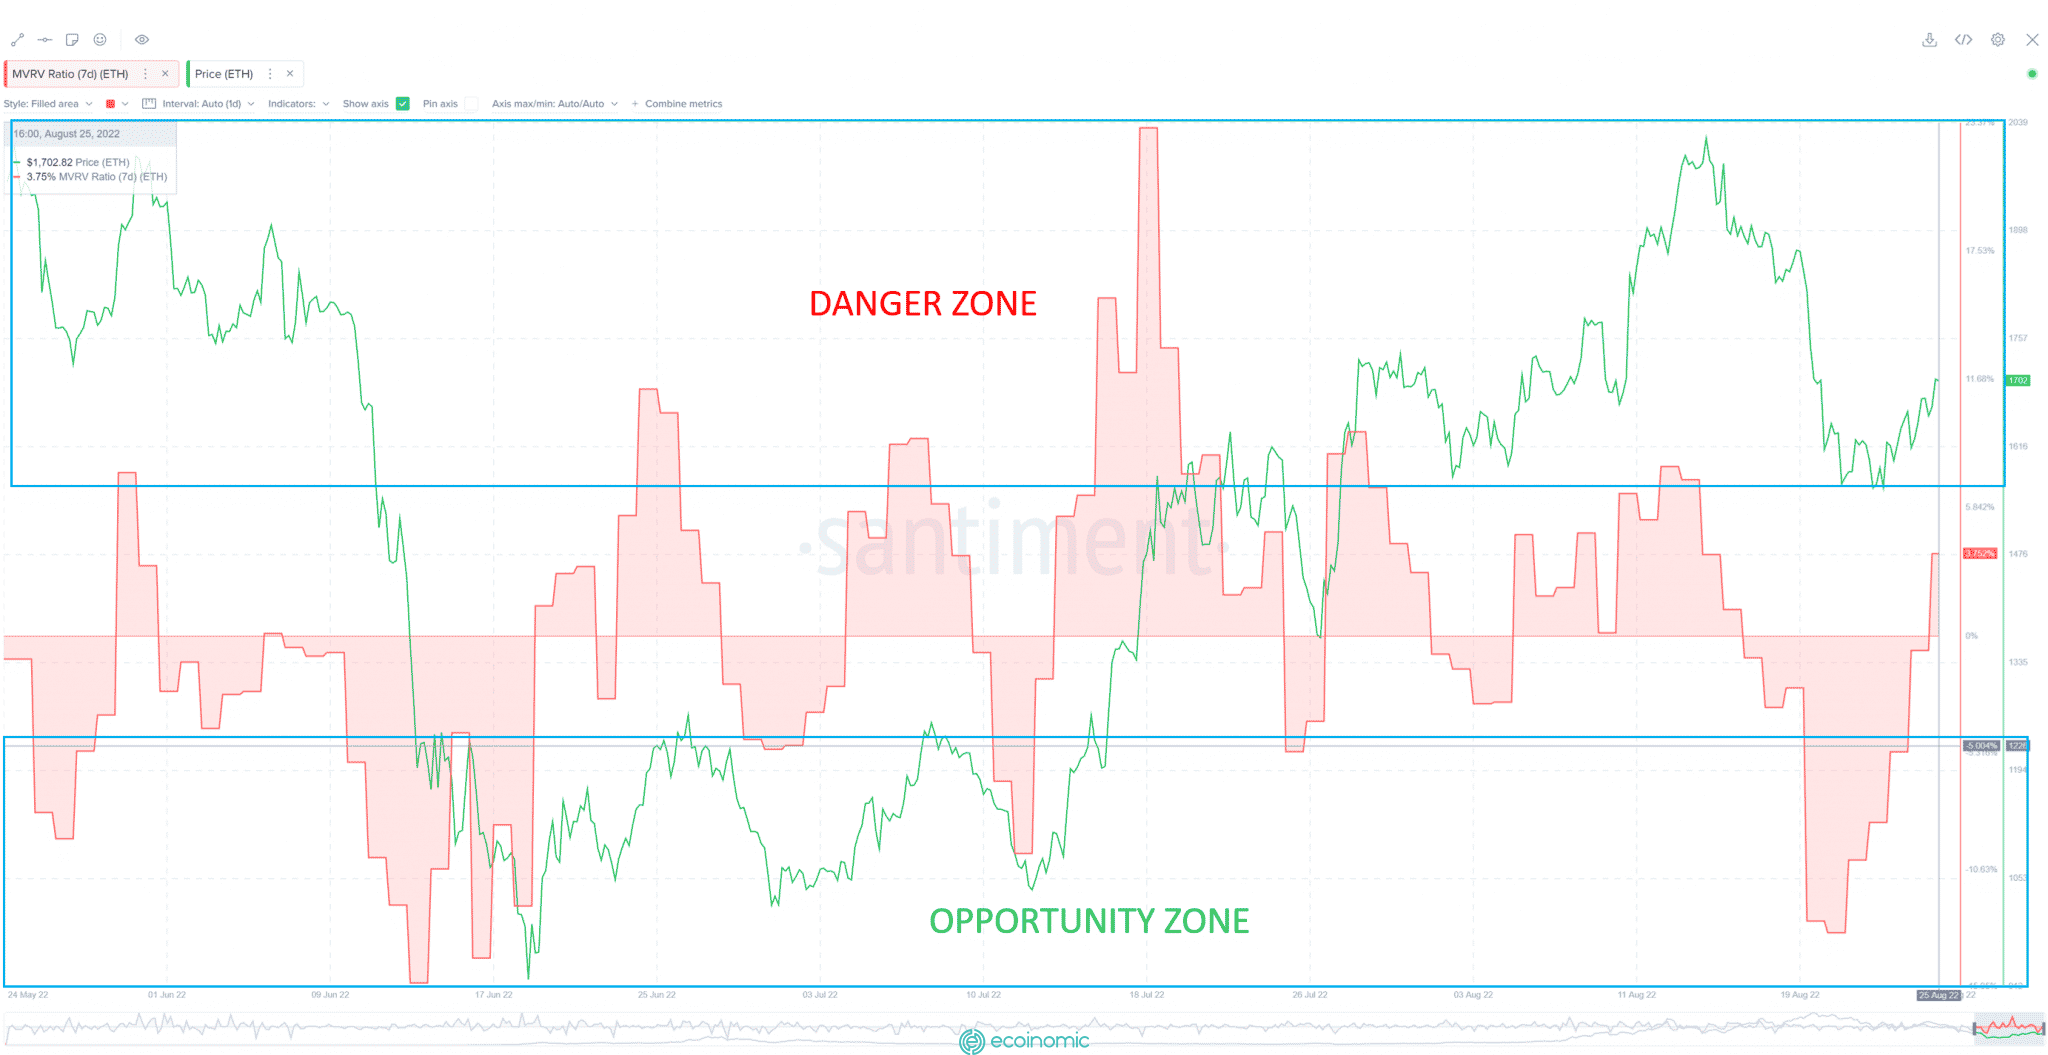
Santiment also found that the seven-day MVRV revealed that the market is in the neutral zone after breaking out of the opportunity zone.

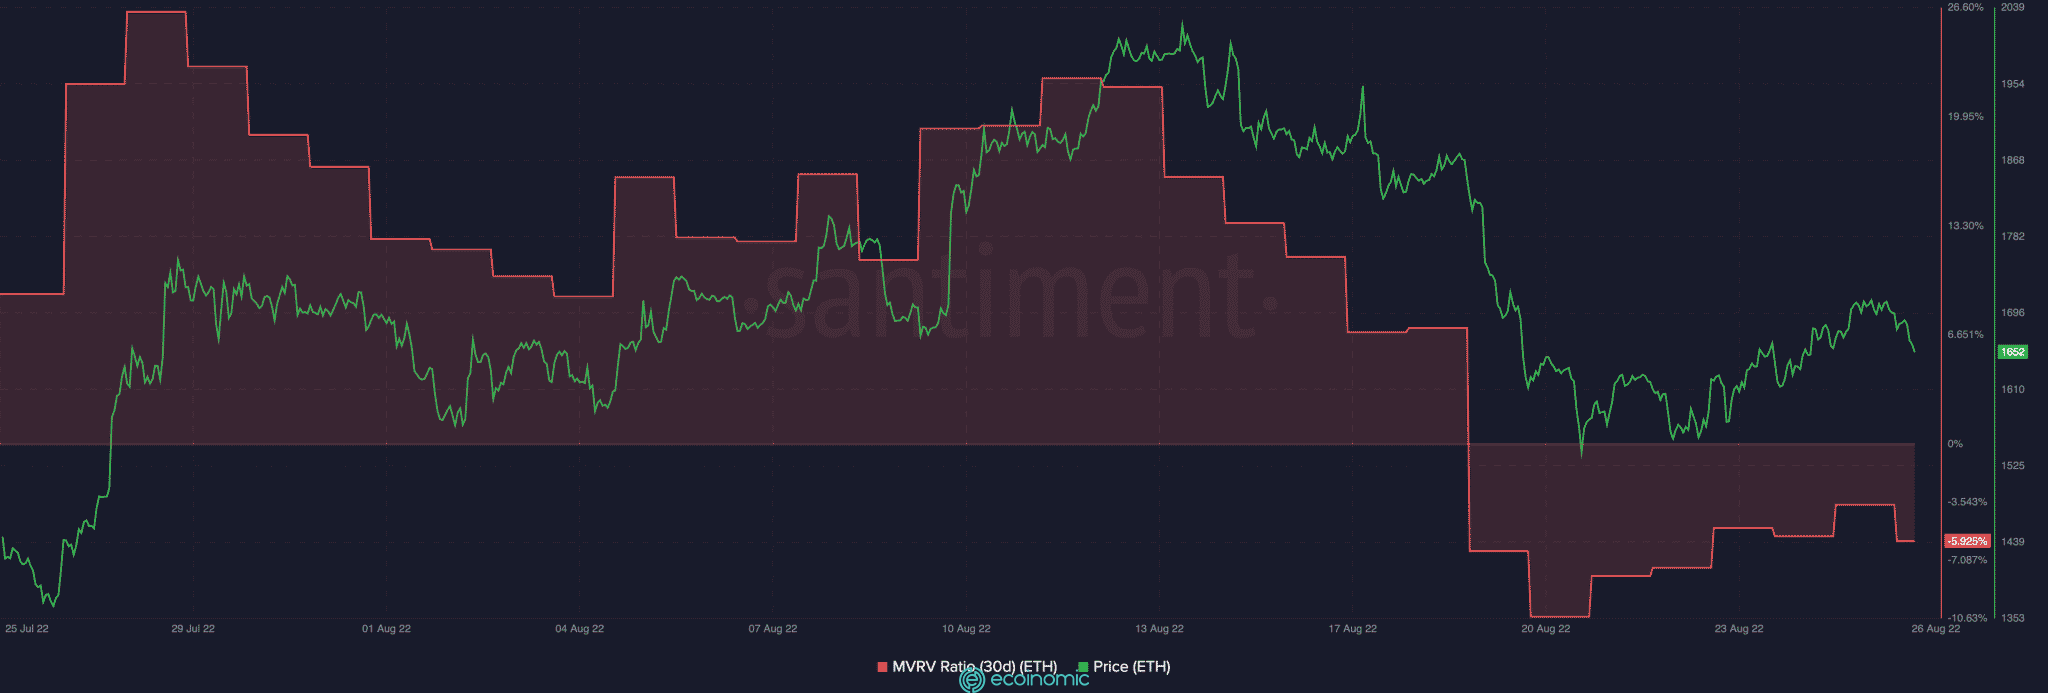
For MVRV 30, this index has a negative value of -5.925% as of the time of this writing.


