Advertisement
Cryptocurrencies such as Bitcoin, ATOM, APE, CHZ, and QNT are facing resistance at higher levels, but chart patterns suggest that the current recovery could last for several more days.
The U.S. stock market surged last week, ending a three-week streak of declines. The S&P 500 rose 3.65%, and the Nasdaq Composite gained 4.14%. Closely correlated with the U.S. stock market, Bitcoin (BTC) also made a strong comeback with an attempt to end the week with a gain of more than 7%.
The strong recovery in the stock market and the cryptocurrency market are showing signs of forming a bottom. In fact, it is too early to predict the start of a new bullish move. The stock market is likely to remain competitive until the release of U.S. Inflation data on September 13 and the results of the Federal Reserve meeting on September 20-21.

Along with capturing signals from the stock market, the crypto space also has its own important events. Both Ethereum Merge and Cardano’s (ADA) Vasil hard forks over the next few days could increase the volatility of some cryptocurrencies.
Although volatile markets increase risk, they can provide short-term trading opportunities for fast traders. Let’s study the charts of five cryptocurrencies that may be of interest to many investors in the near future.
BTC / USDT
Bitcoin soared above its 20-day exponential moving average ($20,662) on September 9. This is the first sign that selling pressure may be easing. The bears are trying to prevent a rebound at the 50-day simple moving average ($21,946), but a positive sign is that the bulls have not given up yet.
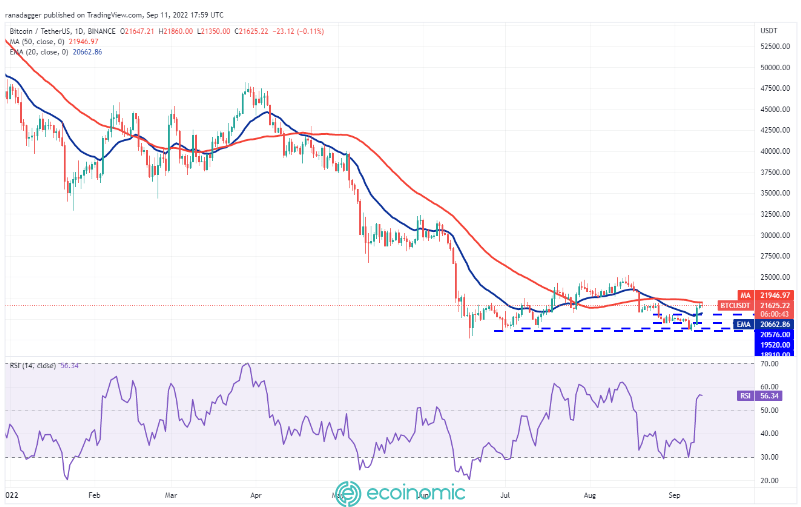
The 20-day EMA is starting to show signs of a steep rise. The Relative Strength Index (RSI) is in the positive zone. These suggest that going up will meet less resistance. If the bulls push the price above the 50-day SMA, the BTC/USDT pair can rally towards the stiff resistance at $25,211. If this happens, the bears will definitely make every effort to protect this resistance level.
Another possibility is a fall in price from the 50-day SMA. If that happens, the pair could fall to the 20-day EMA. This is an important level to watch as a break and close below that level could cause the price to drop to $18,626. Also, if the price recovers from the 20-day EMA, the price is likely to break above the 50-day SMA.
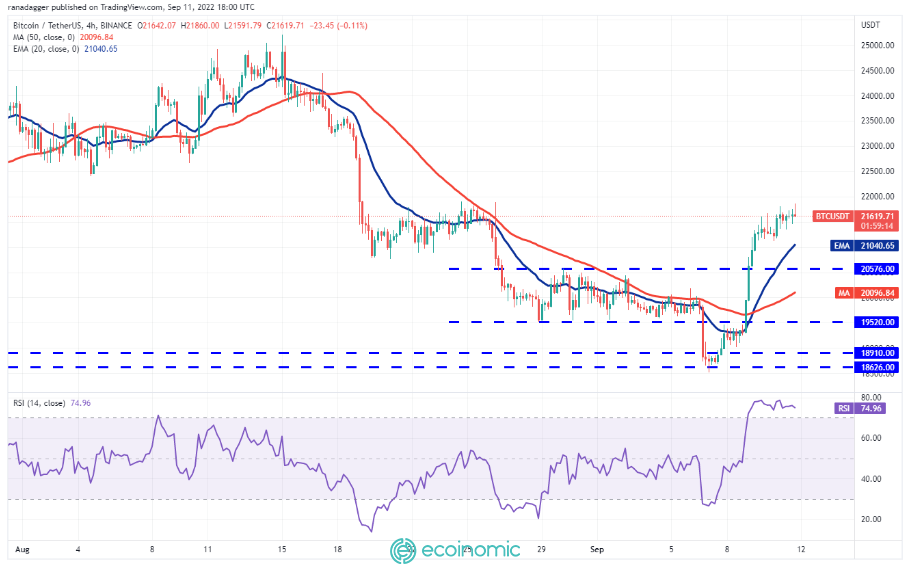
The pair regained momentum after breaking the $19,520 resistance level. The strong recovery has pushed the RSI into the overbought zone, indicating minor consolidation or correction in the near term. Buyers are facing a tough challenge near the $22,000 mark but they have not given in to the bears.
If the bulls push the price above $22,000, the pair can quickly recover towards $23,500, and the bears try to stop the rally.
Contrary to this assumption, if the price falls and breaks below the 20 EMA, the pair can fall to $20,576. A break below this level could cause BTC/USDT to consolidate in a large range between $22,000 and $18,626 for some time.
ATOM / USDT
Cosmos (ATOM) broke through the overhead resistance of $13.45 on September 8, which indicates demand at a higher level. The next strong resistance level is $20.30 and could trigger a rally.
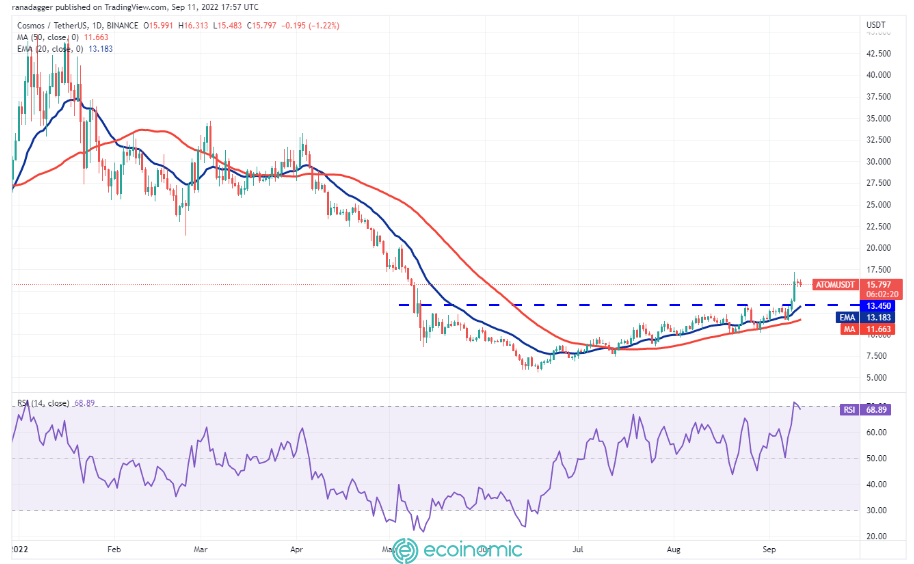
However, before that, the bears will try to pull the price below the breakout level of $13.45. This is an important level to watch as it is possible that a break and close below that level could be a sign that the recent breakout is a bullish trap.
On the other hand, if the price rises from the current level or recovers from the $13.45 level, the bulls are in control and are buying at each dip. If the bulls push the price above $17.20, a bullish move can begin and reach $20.30.
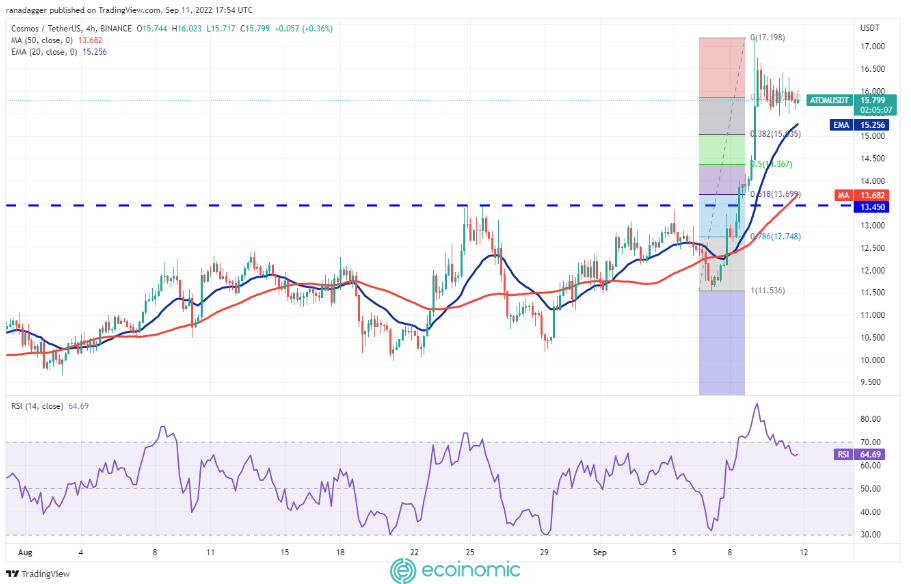
The 4-hour chart shows that the ATOM/USDT pair has risen after breaking through the overhead resistance of $13.45. That pushed the RSI deep into the overbought zone and started correcting. But a positive sign is that the bulls have not yet given up on their bullish efforts.
If the price recovers and breaks out of the current levels, a breakout above $17.20 is entirely possible. If that happens, the bullish move can continue and the pair can rise to the level of $20.30.
This positive view may be invalidated in the short term if the price continues lower and plummets below the 20 EMA. If that happens, the pair could fall to the 50% Fibonacci retracement level of $14.36.
APE/USDT
ApeCoin (APE) has rebounded strongly from the $4.17 support level indicating strong buying activity at the lower levels. This is a signal that the correction period may be over, making APE one of the coins of special interest in the near future.
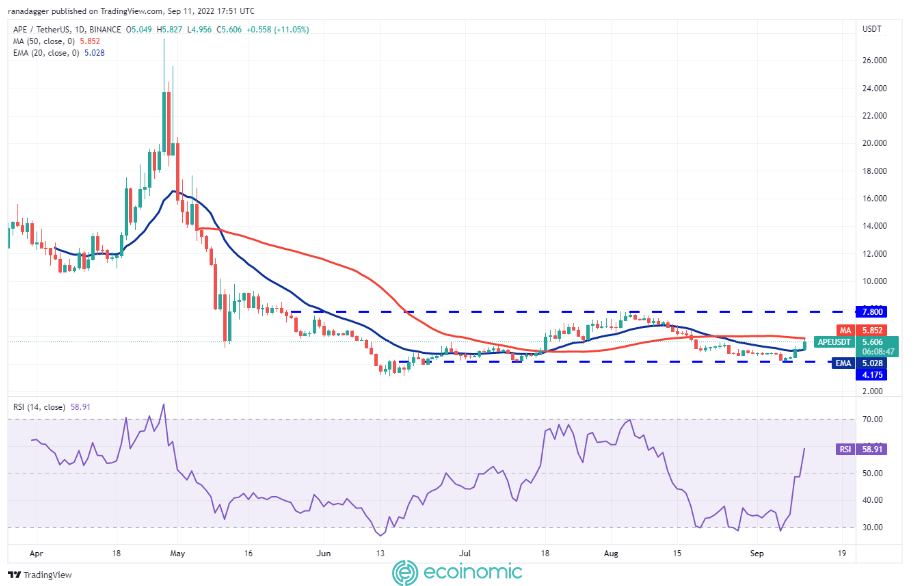
Buyers pushed the price above the 20-day EMA ($5) on September 9, and the APE/USDT pair formed an intraday Doji candlestick pattern on September 10. However, the price increase has resolved these uncertainties.
The APE on 9/11 had a strong rally to the 50-day SMA ($5.85). The bears may have tried to stop the rally at this level. If the price falls from the current level but bounces off the 20-day EMA, it indicates that the sentiment has turned positive and traders are buying at the downside. The bulls will then again try to move the price above the 50-day SMA. If they do that, the pair could soar towards the overhead resistance of $7.80.
This positive view can be invalidated in the short term if the price falls and breaks below the 20-day EMA. In that case, the pair could fall to $4.17.
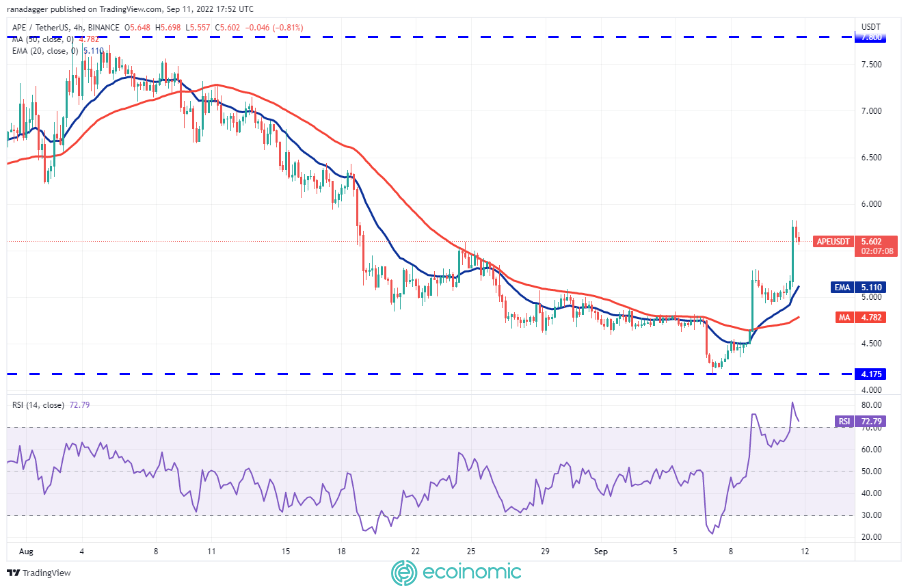
The 20 EMA on the 4-hour chart has started to rise and the RSI has risen into the overbought zone. This shows that the bulls have the upper hand and there is a possibility of a pullback in the short term.
If the price falls from the current levels but rebounds to $5.30, it will show strong demand at the lower levels. The bulls will then make another attempt to push the price above $5.83 and extend the rally to $6.44.
Also, if the price falls and breaks below the 20 EMA, the advantage may be in favor of the bears.
CHZ/USDT
Chiliz (CHZ) broke above the 20-day EMA ($0.20) on September 9, which is the first sign that the correction period may be over. Therefore, this token has entered the top of the coins that are of interest to investors and traders.
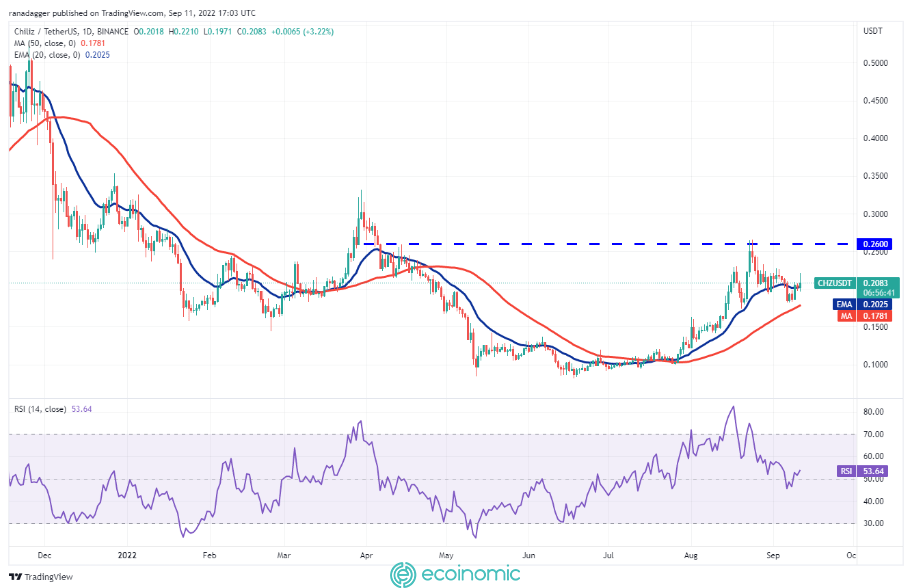
The bears tried to pull the price back below the 20-day EMA on September 10 but the bulls held their ground. Buyers are trying to push the price towards the overhead resistance of $0.26 but the upside move could face fluctuations near the $0.23 level.
If the price falls but does not fall below the 20-day EMA, it will increase the likelihood of a rally to $0.26. Contrary to this assumption, if the price turns down and breaks below $0.20, it will indicate that the bears are operating at higher levels. That could drag the price down to the 50-day SMA ($0.18).
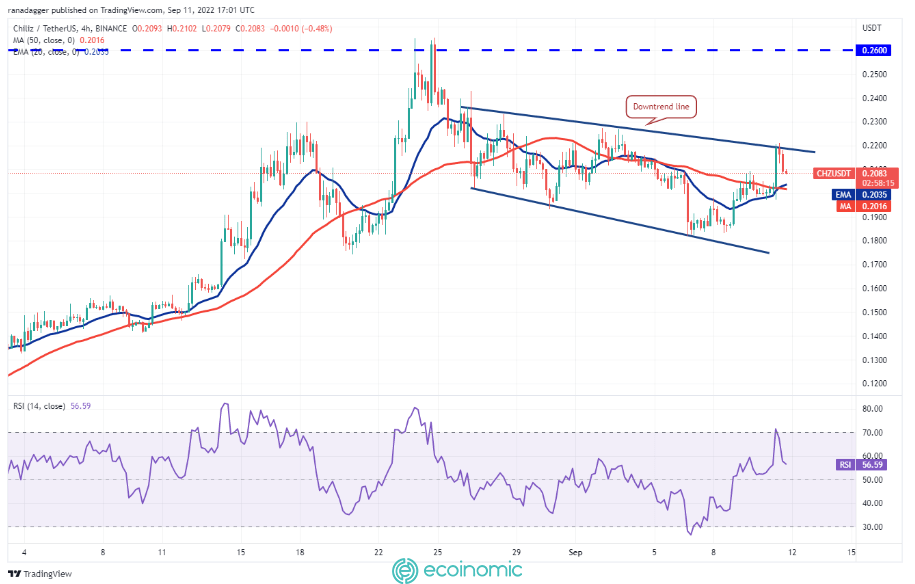
The 4-hour chart shows that bears are defending the downtrend line. If the price falls from the current levels but bounces off the moving averages, it will indicate that the bulls are trying to make a comeback.
After that, the buyer will again try to bring the price above the downtrend line. If they succeed, the pair can start rising rapidly towards $0.23 and then to $0.26.
Also, if the price plummets below $0.20, it will indicate that the pair may remain in a bearish direction. That could pull the price down to $0.18.
QNT/USDT
Quant (QNT) did not break below strong support at $87.60, indicating that sentiment is positive and the bulls are buying as prices fall.
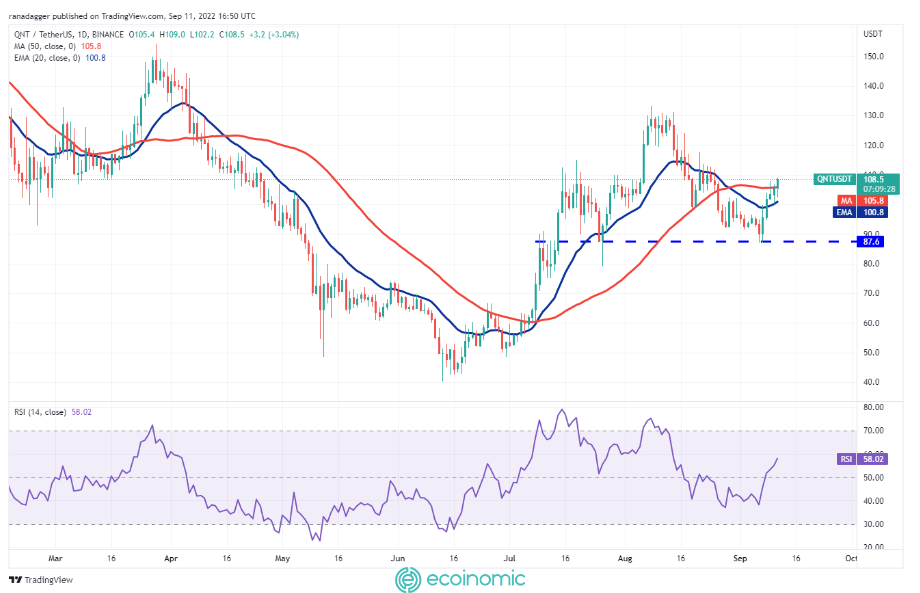
The strong rally from $87.60 broke above the 20-day EMA ($100) on September 8, which is the first sign that the correction period may be over. The bears posed a strong challenge near the 50-day SMA ($105) but were unable to push the price back below the 20-day EMA.
This indicates that the sentiment has turned positive and the bulls are buying as the price falls. Buyers pushed the QNT/USDT pair above the 50-day SMA on September 11. If the bulls sustain higher levels, the pair can rally to $117 and then to $124. A breakout above this level could open the door to a rally to $130.
This bullish view can be invalidated if the price falls and breaks below the 20-day EMA. If that happens, the pair could fall to strong support at $87.60.
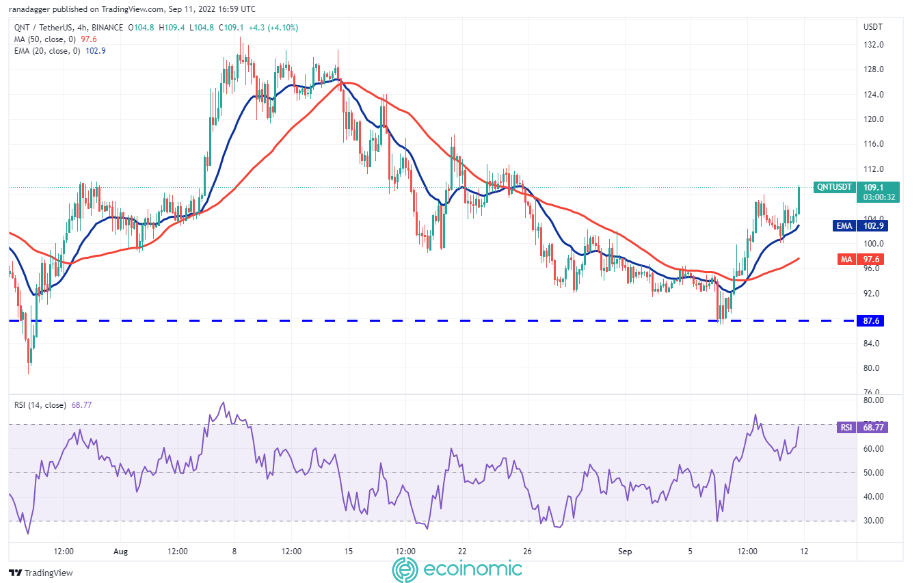
The 4-hour chart shows that the pair has rebounded sharply from the support at $87.60. The bears have posed a strong challenge near $108 but a positive sign is that the bulls bought on a fall to the 20 EMA. This suggests that traders are looking at a discount as a buying opportunity.
Buyers have continued their recovery by pushing the price above the overhead resistance at $108. The pair can rise to $113 and then to $117. Conversely, if the price falls and plummets below the 20 EMA, the pair can fall to the 50-SMA line.


