Advertisement
Bitcoin (BTC) surged significantly on Wednesday and is showing early signs of a potential uptrend reversal.
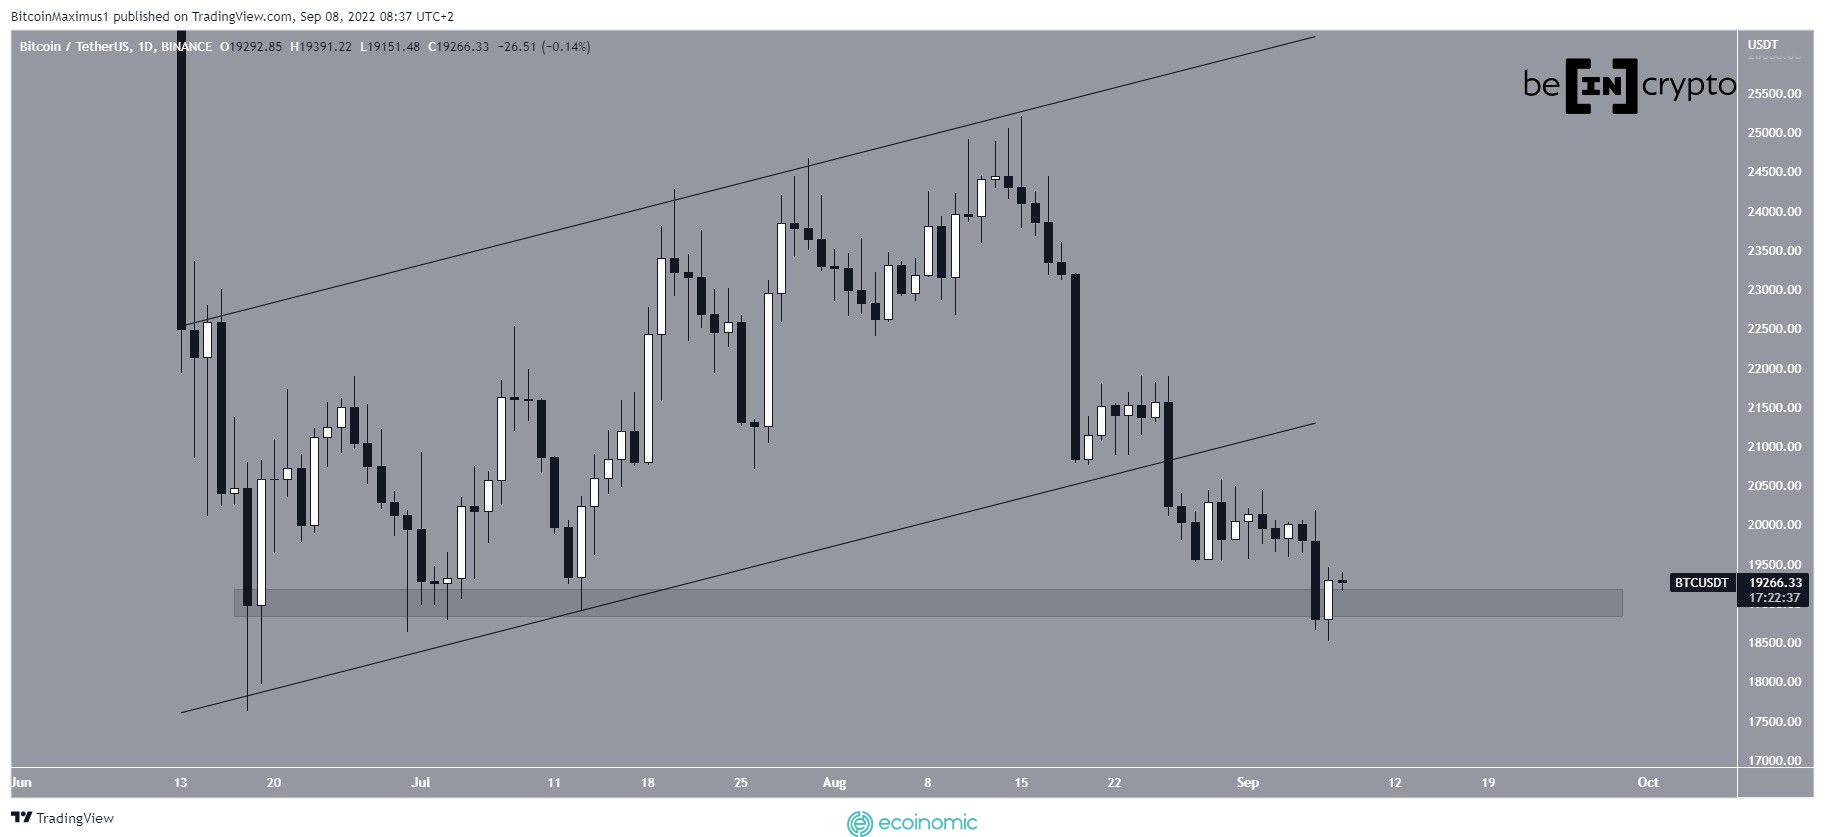
BTC has been falling since reaching a high of $25,211 on August 15. Bitcoin continued to decline and reached a low of $18,510 on September 7. The low was recorded slightly below the $19,000 support zone, created by the June low. However, the price rose soon after and regained the area in the process.

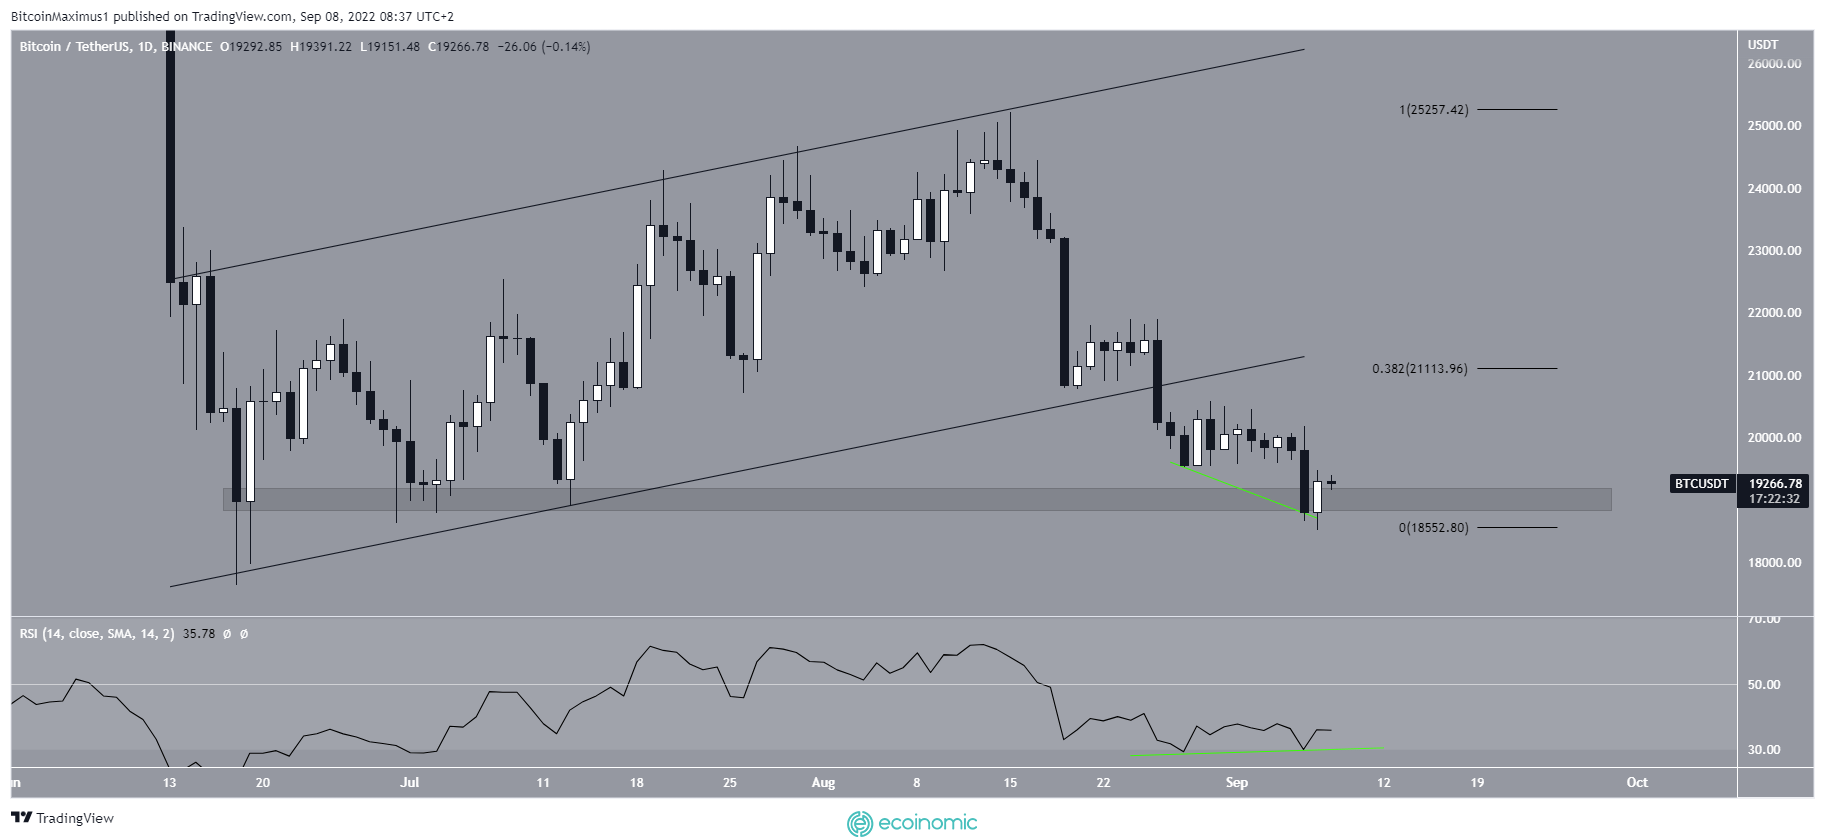
Technical indicators support the possibility of a rebound. This can be seen in the daily RSI, which has created bullish divergences (which appear in a downtrend, when the price creates a lower bottom than the previous one, but the indicator creates a higher bottom).
Moreover, the RSI rose before approaching the oversold zone. This is often a harbinger of significant price increases.
If this happens, the nearest resistance zone will be $21,100. This is a retracement resistance level of 0.382 Fib and coincides with the support line of the previous line.

Analysis of the number of BTC waves
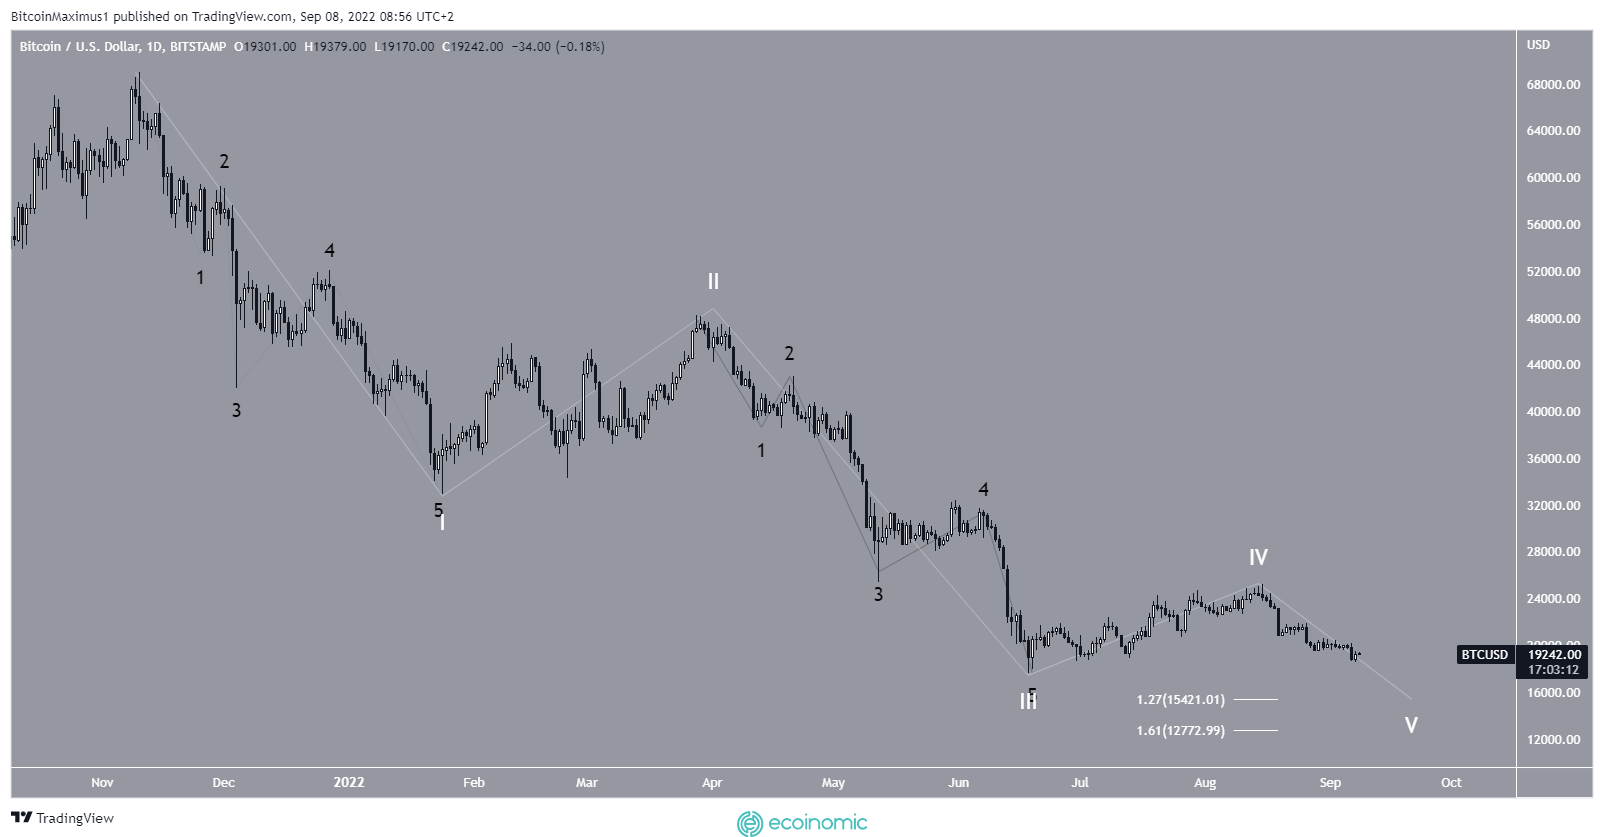
The number of waves indicates that BTC is in the fifth and final wave of a downtrend (white) that began with an all-time high price in November.
If true, the downtrend will take Bitcoin below its June lows, potentially dropping to $15,420 or $12,770. The above targets were found using the external Fib retracement levels 1.27 and 1.61 of wave four (white).

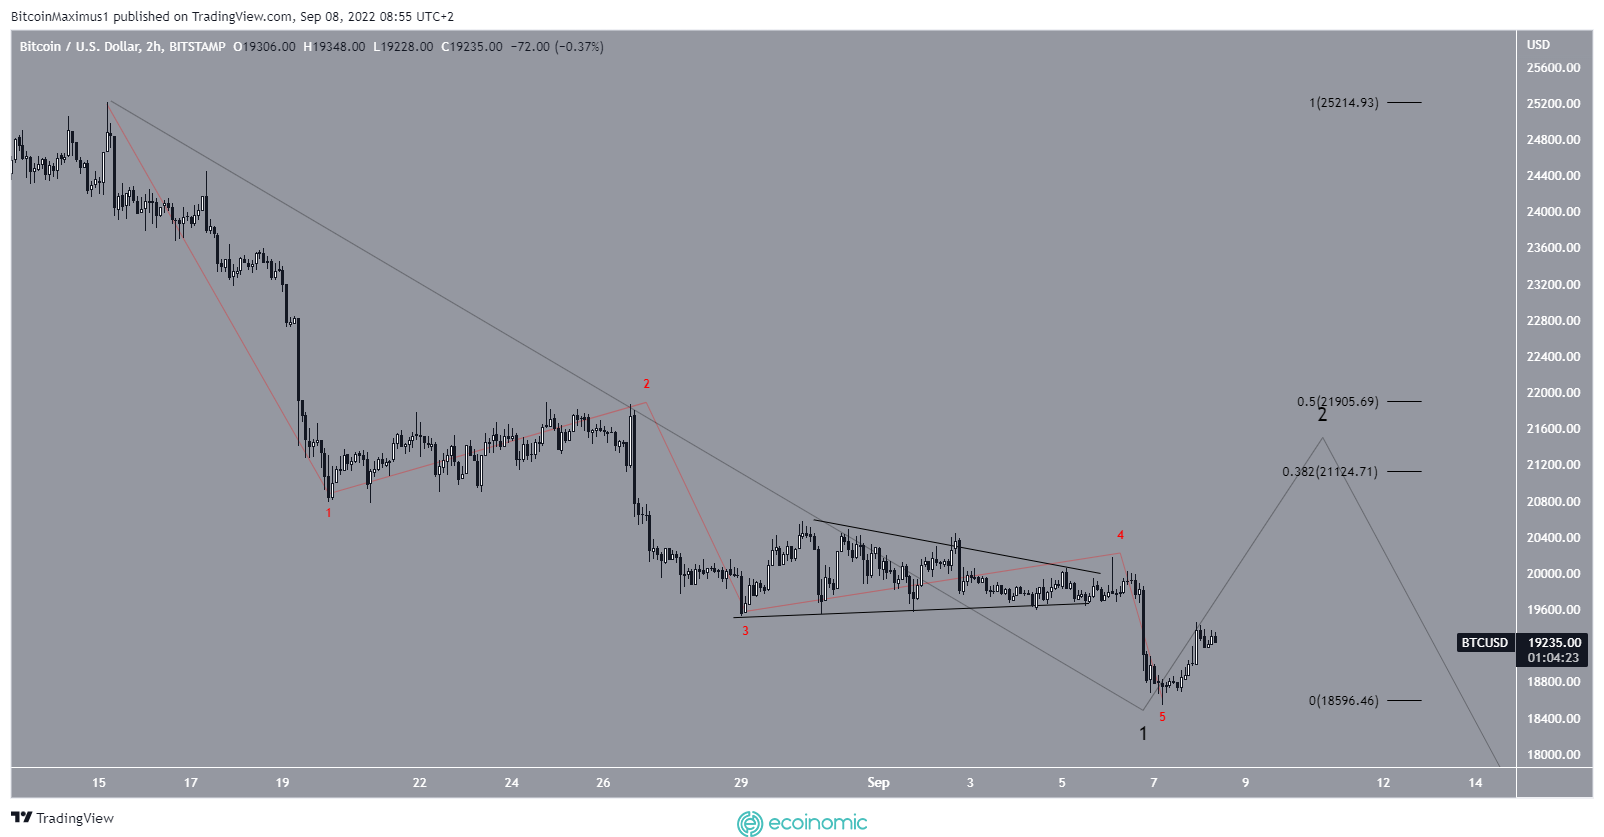
However, the short-term number (red) indicates that the downtrend of the five waves has been completed. Not sure if this is the entire fifth wave from the previous image, or if it has been truncated.
In either case, a significant uptrend is possible, whether it is a rebound towards $21,200 to $21,900 or a new uptrend reversal.


