Advertisement
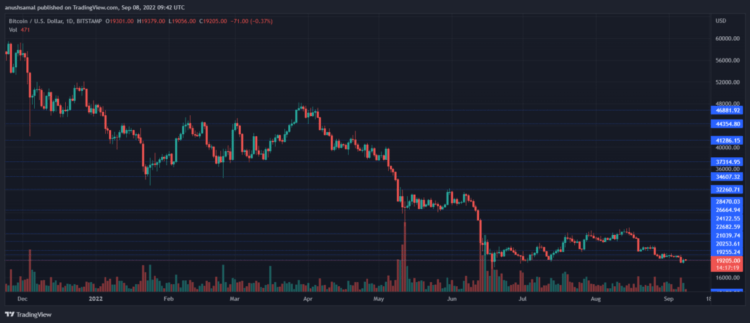
Bitcoin price was beaten by the bears after trading around the $20,000 mark for quite some time. Over the past 24 hours, the coin has dropped 2.1 percent, and over the past week, the Bitcoin price has lost nearly 5 percent of its value.
At the moment, it is trading at a price of $19,000. The price fluctuations of the cryptocurrency market are directly related to US Federal Reserve’s move to raise interest rates.
Similarly, Bitcoin continues to face selling pressure on the chart.
The technical outlook continues to show a decrease in purchasing power. If the coin continues to show minimal price action, the Bitcoin price could once again drop to the $18,000 region.
There is a tight zone in which Bitcoin is already traded, and without the help of buyers, a move above the current resistance zone seems unlikely.
In this case, Bitcoin could fall sharply in subsequent trading sessions.
Bitcoin price analysis in one-day chart

BTC was trading for $19,100 at the time of writing. After trading around the $20,000 price for a considerable amount of time, selling pressure is mounting.
The upper resistance level of this coin is $20,200 but Bitcoin can stop at $19,600. A move above $20,200.
If the coin continues to decline due to selling pressure, it could break below the $18,000 mark and drop to trade near $15,000.
A move above the $24,000 price could also help the Bitcoin price rise to $30,000. The amount of Bitcoin traded has decreased significantly in the past session, indicating an increase in selling power.
Technical Analysis

BTC recorded a sharp drop in demand on its one-day chart. This means that demand for Bitcoin above the price of $19,000 is high. This can increase purchasing power.
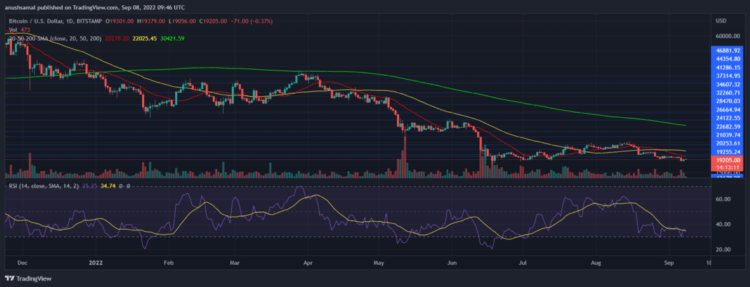
The RSI – Relative Strength Index is below halfway and quite close to the oversold zone. However, there is a small increase, which does not mean that buyers have returned.
The Bitcoin price has moved below the 20-SMA line and that signals that sellers are driving the price dynamics in the market.

Other Bitcoin technical indicators have also indicated a bearish trend on the chart.
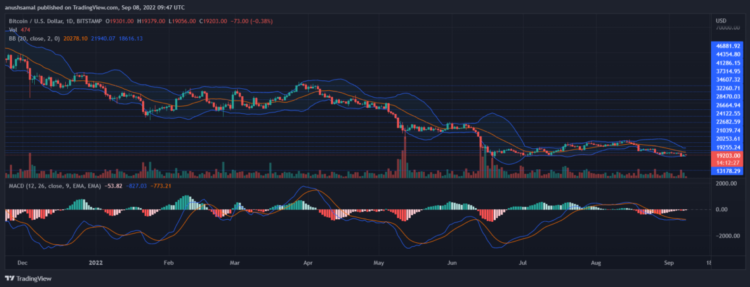
The MACD line has intersected in a downtrend and red bars appear, which are a sell signal for this coin.
Bollinger Bands represent price movements and opportunities for price movements. The bands have tightened and it is a sign of upcoming price movement or an explosive price movement.
Once the price of Bitcoin rises above the 20 SMA then Bitcoin can rise sharply on the chart.


