Advertisement
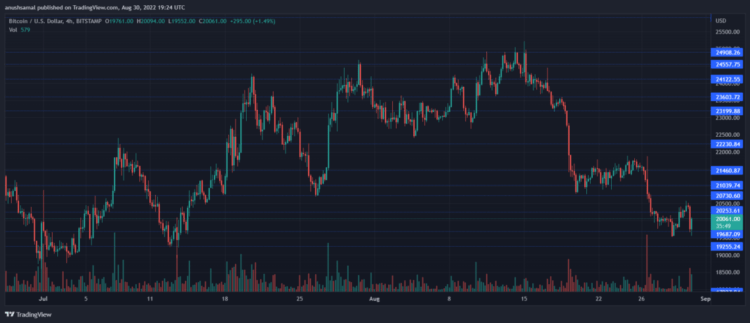
Bitcoin price over the past 24 hours has plummeted on the 4-hour chart. Recently, Bitcoin surged above the $20,000 mark but the bears were unable to hold the asset at that price mark.
Over the past 24 hours, the coin has mostly consolidated on its chart.
Over the past week, BTC has fallen 9% due to lower demand. And this pulled the cryptocurrency price below the immediate resistance mark.
The technical outlook for this coin is bearish due to the fact that sellers are active in the market at the time of writing. If buyers do not return to the market, the Bitcoin price will trade near its nearest price and move towards a support level below that.
It is important that this coin will reach a price of $20,000 in subsequent trading sessions, otherwise, it will fall below the price of $18,000.
The global cryptocurrency Market Cap today is $996 billion, down 2.7% over the past 24 hours.
Bitcoin Price Analysis on 4-Hour Chart

BTC was trading for $20,600 at the time of writing. For much of the past 24 hours, the coin has struggled below the $20,000 price mark.
Bitcoin is still quite unstable at the moment, how long the Bitcoin price will remain above that price mark is something to consider.
BTC’s next stop if it does not trade near the next resistance level will be $18,000. The overhead resistance level of this coin is $21,100. If Bitcoin rises above that level then the next attempt will be to touch $22,000.
On the other hand, if BTC fails to sustain above the $18,000 mark, then $17,000 could very well be the next stop for this top coin.
Technical Analysis

BTC has an increased selling power when the price falls. This indicates higher demand at lower prices.
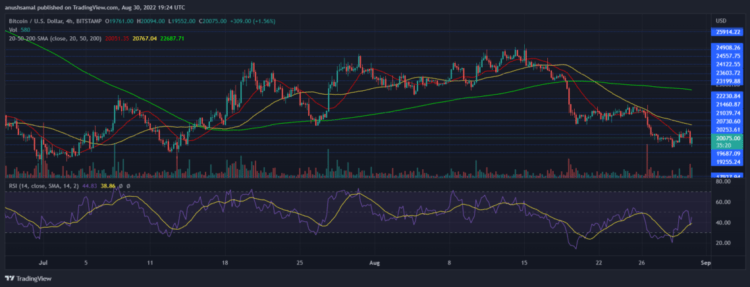
Technical indicators also show increased bearish momentum. The RSI Relative Strength Index is below which means that sellers outnumber buyers in the market.
Bitcoin’s price is below the 20-SMA line, which is a sign that sellers are driving price dynamics in the market.

Other Bitcoin technical indicators also indicate that purchasing power is increasing on the 4-hour chart.
Moving averages indicate the momentum and the change in the price trend.
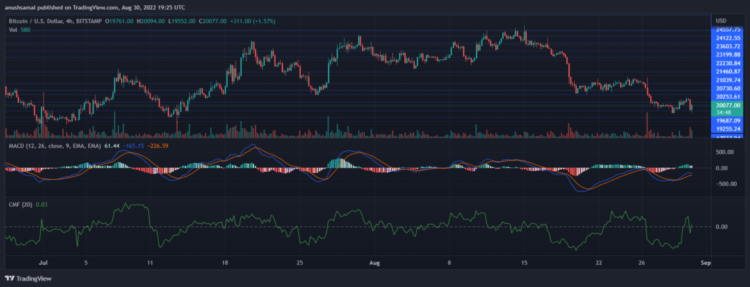
MACD shows a buy signal.
Chaikin Money Flow signals capital inflows and outflows. The current CMF shows more inflows than inflows.


