Advertisement
Bitcoin is trying to make a wave of recovery above $21,500. BTC must break through the $22,650 resistance zone to move into the positive zone.
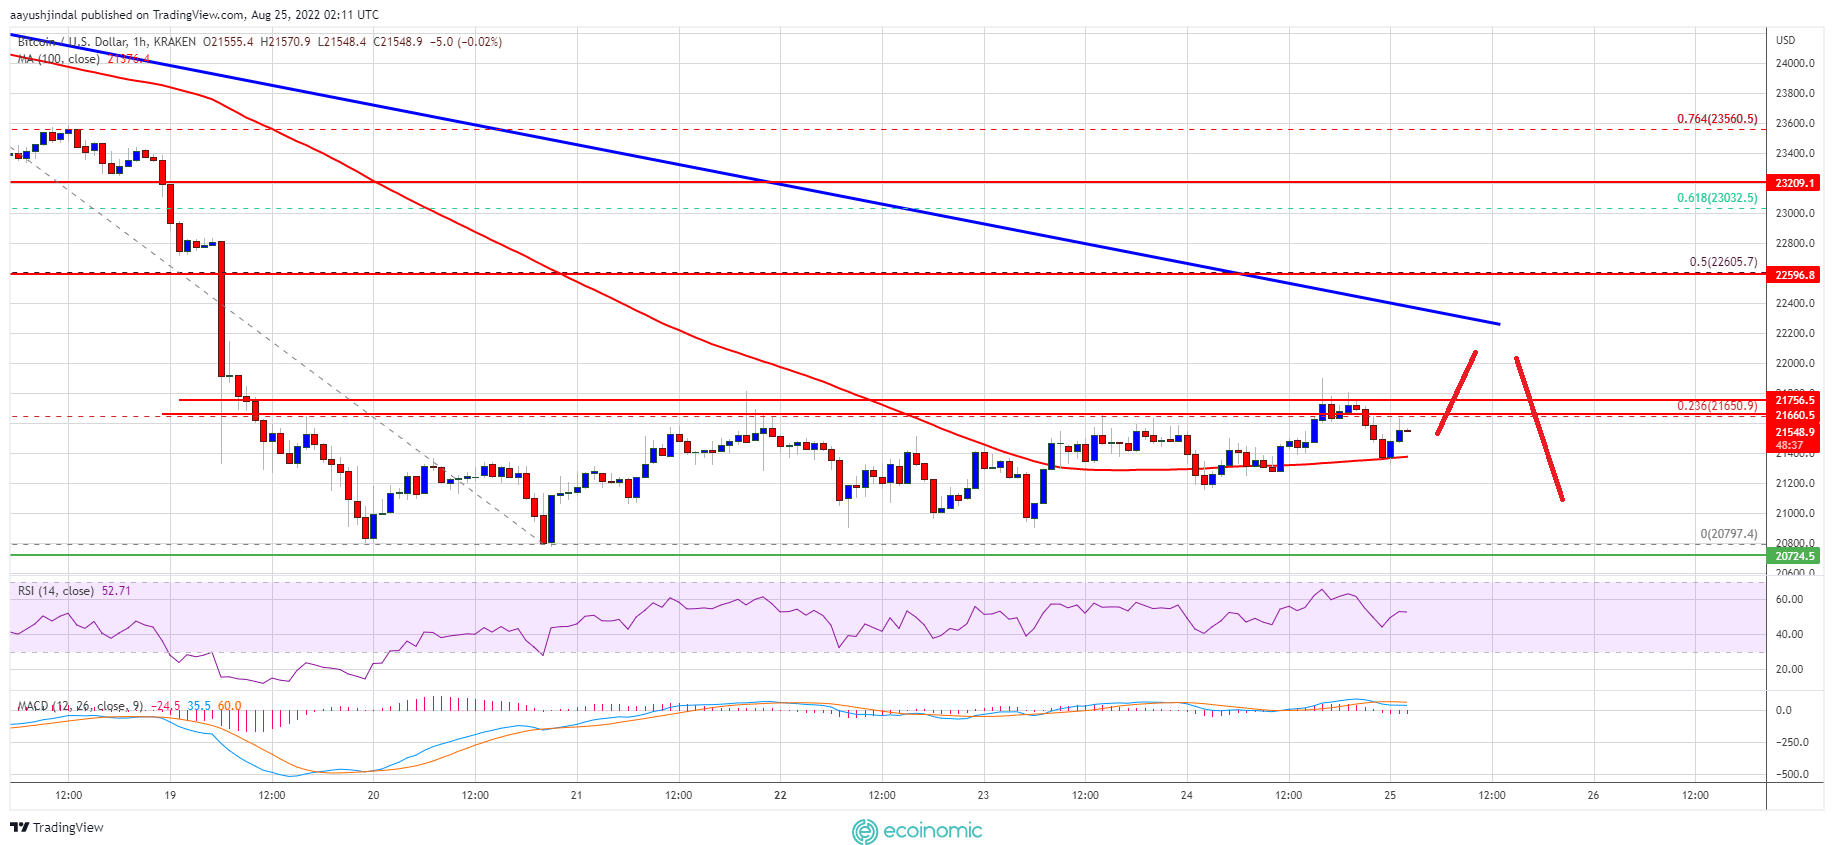
- Bitcoin is gradually rising above the $21,400 and $21,500 levels.
- Btc price is currently above $21,400 and a 100-hour simple moving average.
- There is a major bearish trendline forming with resistance near $22,400 on the hourly chart of the BTC/USD pair
- The pair is more resilient, but the bears may still be active near the $22,650 zone.
Bitcoin Price Is Trying to Recover
The Bitcoin price seems to be forming a base above the $21,000 support zone. BTC is gradually rising above the $21,200 and $21,400 levels.
There is a small rally above the $21,500 resistance zone and the 100-hour simple moving average. The price even soared above the 23.6% Fib retracement of the main drop from a high of $24,416 to a low of $20,797.
However, the price was unable to break through the $21,650 resistance zone. Bitcoin is currently trading above $21,400 and the 100-hour simple moving average.
On the positive side, immediate resistance is near the $21,650 and $21,700 levels. The first major resistance on the upside is near the $22,000 level. The next key resistance level could be near the $22,500 zone. There is also the main downtrend line forming with resistance near $22,400 on the hourly chart of the BTC/USD pair.

The main barrier may be near the $22,650 zone. It is close to the 50% Fib retracement of the main drop from a high of $24,416 to a low of $20,797. If there is a breakout above the $22,650 resistance zone, the price can rally to the $23,500 resistance zone. Any further gains could bring the price toward the $24,000 resistance zone.
Will Bitcoin enter a new price drop?
If Bitcoin fails to break through the $22,500 resistance zone, it could initiate another rally. Immediate support can be at $21,400 and the 100-hour simple moving average.
The next major support is now located near the $21,000 level. A clear move below the $21,000 support level could increase selling pressure in the near term. In the stated case, the price may fall to the level of $20,000.
Bitcoin Technical Indicators:
- HOURLY MACD: MACD is currently losing speed in the gain zone.
- Hourly RSI (Relative Strength Index): The RSI for BTC/USD is currently just above the 50 level
- Key support levels: $21,400, followed by $21,000.
- Key resistance levels: $21,650, $22,000, and $22,650.


