Advertisement
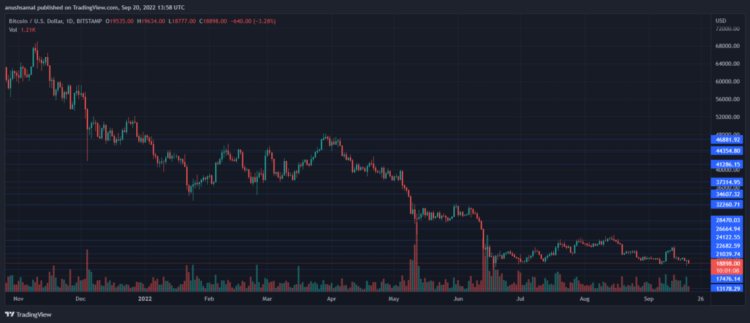
Bitcoin price has continuously plummeted after hitting the $20,000 mark. Over the past 24 hours, the Bitcoin price has moved very slightly. Over the past week, BTC has lost almost 16% of its value. BTC quickly managed to recover from the $19,000 price mark on its chart.
However, the bulls were unable to defend that price. The nearest support line for bitcoin price is $18,000. The overall price trend of Bitcoin over the past few months has been bearish. The technical outlook of this coin is also bearish.
Selling pressure continues to exceed the buying force on the one-day chart. The $20,000 price mark is a strong resistance. $20,000 is an important resistance point for the Bitcoin price. Increased purchasing power could provide the coin with some temporary relief.
The global cryptocurrency Market Cap today is $962 billion, with a positive change of 0.6% over the past 24 hours.
Bitcoin Price Analysis on a Day Chart

BTC is trading at $18,800 at the time of writing. In the previous few sessions, Bitcoin had been trading above the $19,000 price mark. The above resistance level of this coin is $20,000, a mark that BTC has struggled to overcome over the past few days.
The sharp drop in purchasing power has caused BTC to quickly fall further. If BTC moves above the price of $20,000, the bearish trend can be stopped.
On the other hand, the easing demand could even drag the price of Bitcoin down to $17,400. If that happens, the Bitcoin price could even fall to $14,000.
The amount of Bitcoin traded in the last trading session has decreased, meaning that the seller has taken over the market at the time of writing.
Technical Analysis

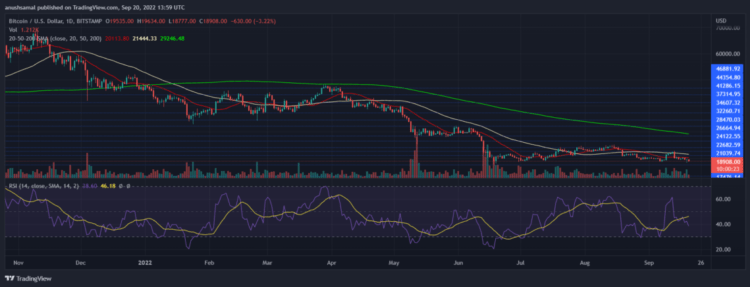
Buyers fell causing the price of Bitcoin to continue to fall. The buying force plummeted just a week ago and since then, BTC has continued to decline in price on its chart.
The Relative Strength Index – RSI is below the half-line, which means sellers are a lot more than buyers. Bitcoin price has gone below the 20-SMA line, indicating a decrease in demand. It also means that sellers are driving the bullish momentum in the market at the time of writing.

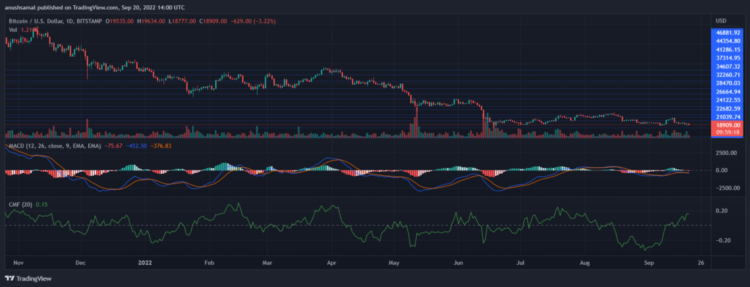
Other technical indicators show a bearish price signal. The MACD line was crossed in a downtrend and then displayed a red chart, which is a sell signal for this coin.
Chaikin Money Flow (CMF), on the other hand, remains on the half-line. This indicator determines the amount of capital entering and exiting. At the time of writing, CMF shows increased inflows.
See also: Bitcoin and Ethereum price recovers, Altcoin reverses most losses


