Advertisement
The FTX (FTT) token has had a hard time, but recently it has been sending a buy signal. This indicates that the price is poised to rise compared to Tether (USDT). The beginning of the week of the cryptocurrency market saw altcoin prices soar as most coins recovered with significant price gains, with the FTX token (FTT) poised to recover.
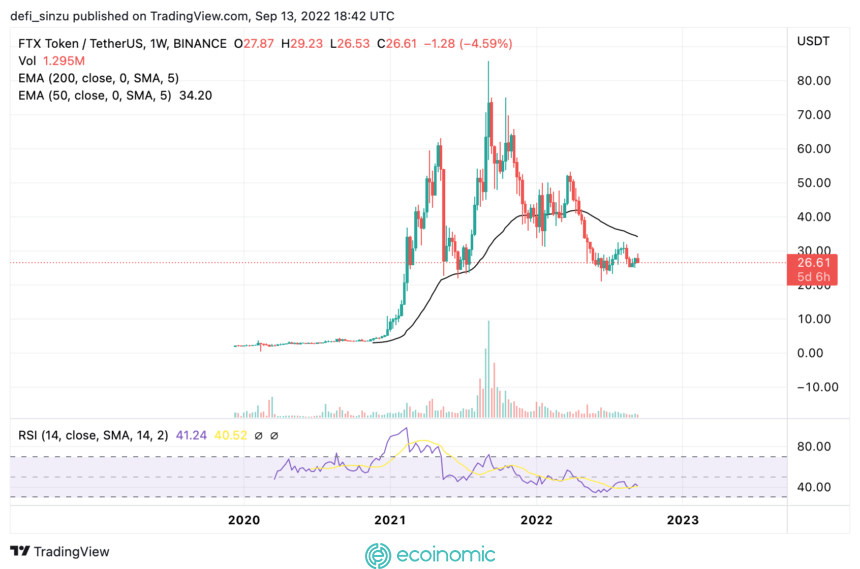
FTX (FTT) token price analysis on weekly charts

FTT price on the weekly chart needs to break out with high volume to give the price a better chance of trading. The FTT must break out and hold above the resistance at $30 to form support for the rising FTT price, as the $30 mark is preventing the FTT from rising.
If the FTT price fails to break through this resistance zone, the price can continue to retest the weekly lower zone of $24, which can act as a good buy zone to push the FTT price higher and avoid a sell-off.
Weekly resistance to FTT price – $30.
Support level for the price of FTT – $24.
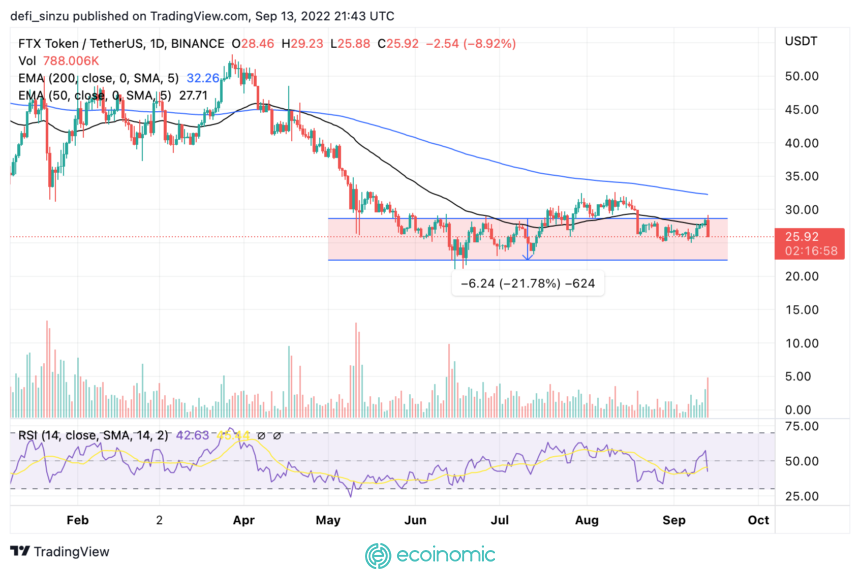
FTT price analysis on daily charts

The daily timeframe for FTT prices seems to change, as prices remain limited. The FTT price failed to hold the main support at $30 as the price moved to resistance, causing a free fall to the $24 zone, where it formed new support that acts as a buy zone.
After hitting a low of $24, the FTT price rebounded, acting as strong support. The FTT price tried to hold above the Exponential Moving Average (EMA) 50 but was rejected. The price of FTT is being restrained by the price of $28, which corresponds to the value of the 50 EMA. In the daily timeframe, FTT is currently trading at $26, below the 50 EMA.
If the price movement increases sharply, the FTT price must cross the 50-day moving average. On the daily chart, the Relative Strength Index (RSI) gives FTT below 50, indicating low bid volumes. With the current buying volume, the FTT price can regain the 50 EMA, which is considered resistance.
Daily resistance to FTT price – $30.
Daily support for FTT price – $24.


