Advertisement
The price of ApeCoin (APE) recently struggled with tether (USDT) after being rejected from $7.50. The Bitcoin (BTC) price has shown some tremendous strength bouncing from as low as $18,500 to as high as $21,000. This has affected other altcoins as most cryptocurrencies generate double-digit gains, including ApeCoin (APE).
ApeCoin (APE) price analysis on weekly charts
APE prices have had difficulty reactivating the bullish move. It has seen prices rise to $7.50 in recent months as the market recovers with bullish sentiment.
After falling from an all-time high of $27.50, APE struggled to sustain its rise as prices fell to as low as $4. The APE price formed a good support level at $4 with the area of interest to buyers and investors.
APE prices ended the week with confusion between buyers and sellers. The new week looks more optimistic, which indicates a rebound strength, and with this momentum from APE, we could see the price return to the $7.5 mark, where it will face higher resistance.
The price of APE is facing resistance due to the impossibility of a bullish trend; if the APE topples this area, we could see prices approaching the $7.50 area and even higher.
Weekly resistance to the price of APE – $7.5.
Weekly support for the price of APE – $ 4.5.

APE sees its price rejected from $7.50 when the price drops to as low as $4. The price of APE has risen from this level after the support levels of the sell order.
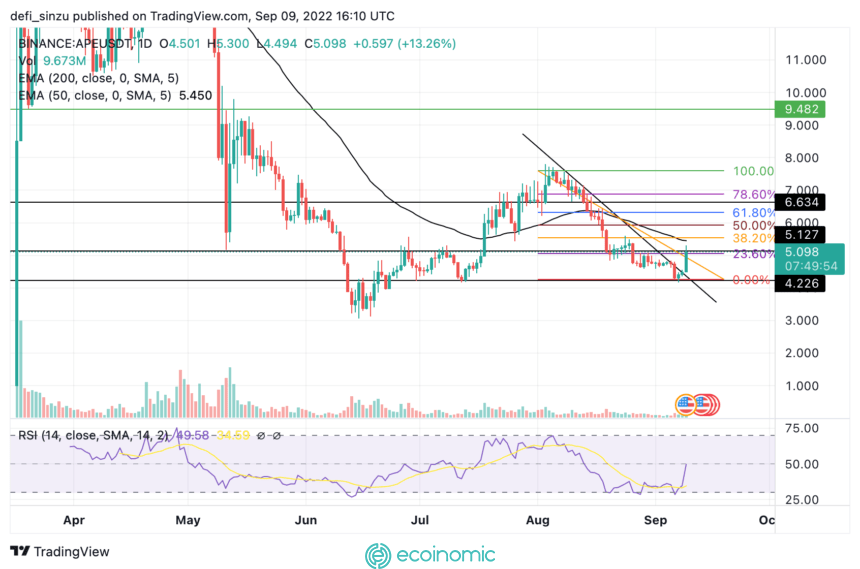
The price of APE rose from a low of $4 to $5.1, where it faced resistance above $5.4.
After the symmetric triangle pattern rose and broke out of the downtrend line, the APE price broke out with a strong uptrend as the price could be set at $7.50. APE that could reach above $5.5 could see the price move higher after the occurrence of bullish movements.
The price of APE trades at $5.1, trying to break out and hold above the 50 EMA in the daily timeframe. The price of $5.5 corresponds to the 50 EMA which acts as a resistance level.
The APE needs to break through the 38.2% Fibonacci retracement value, which acts as resistance to the price of the APE. If the APE breaks out and reaches above this zone, we can see the price reaching $7.50.
Daily resistance to APE price – $5.5.
Daily support for the APE price – $4.
APE price analysis on the 4-hour (4H) chart

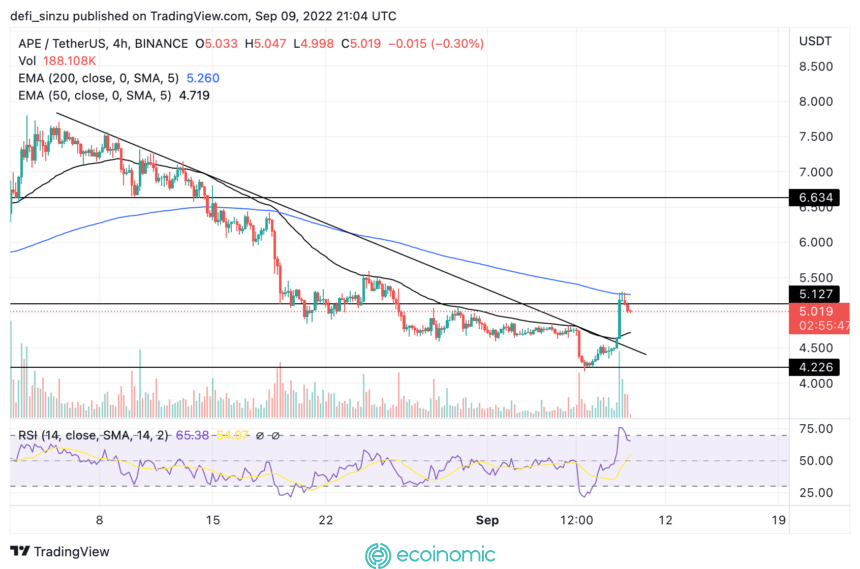
The price of APE in the 4H timeframe continues its upward trend after breaking out of the symmetrical triangle pattern with bullish signs. The trading price was retested below the 200 EMA. A reversal of the 200 EMA acting as resistance to the APE price will mean that the market is carrying a more optimistic sentiment.
The APE price trades above the 50 EMA, with the corresponding price of $4.7 acting as a support zone for the price of the APE.
On the 4H chart, the Relative Strength Index (RSI) gives APE below 75, indicating a high order volume for APE.
Four-hour resistance to APE price – $5.5.
Four-hour support for APE – $4.7-$4.


