Advertisement
The Federal Reserve meeting will take place this week, the results are expected to be announced on September 21, 11 pm Cali USA ![]() time.
time.
With strong volatility and uncertainty, the market holds its breath waiting for the speech of 1 of the most powerful men on the planet with financial markets at the moment: Jerome Powell – Chairman of the US Federal Reserve
Why do traders expect a 0.75% gain to green the crypto market again
The S&P 500 and Nasdaq Composite had their worst week of declines since June, as investors remained concerned that the Federal Reserve would be more aggressive in tightening monetary policy — raising interest rates by 1% to curb Inflation that led to a recession in the United States.
Bitcoin (BTC) remains closely correlated with the S&P 500 and is on track to drop more than 9 percent this week. If this correlation continues, it could cause more damage to the cryptocurrency market.
Goldman Sachs strategist Sharon Bell has warned that a sharp rate hike could send the S&P 500 down 26%.
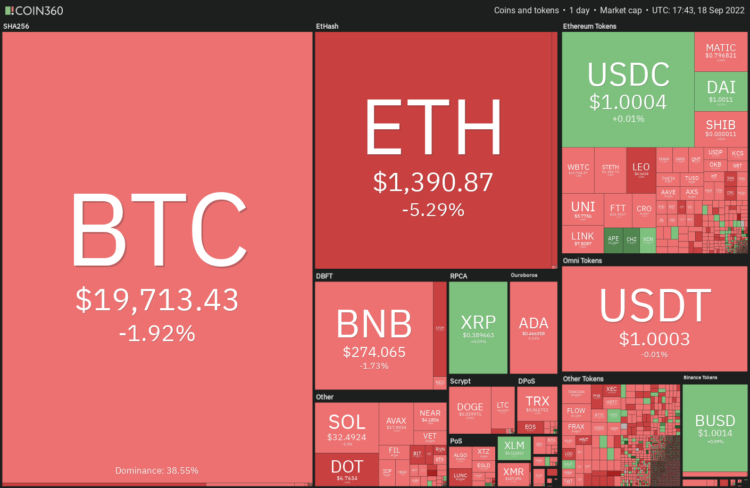
The majority expects the Fed to raise interest rates by 75 basis points at its next meeting on September 20 to September 21.
FedWatch, however, shows that the probability of a 100 basis point rate hike is 18%. This uncertainty can cause traders to stand idly by, leading to heightened short-term volatility.
If the Fed’s rate hike is in line with market expectations, some cryptocurrencies could attract buyers. Let’s study the charts of five positive cryptocurrencies in the near future.
BTC/USDT
Bitcoin (BTC) recovered from $19,320 on September 16 and surged above $20,000 on September 17 as the bulls struggled to sustain the higher levels.
However, the chart shows that the bears are prevailing when there are more resistance levels higher, even if BTC rises, it is unlikely to break through, at least until an official decision from the Fed.
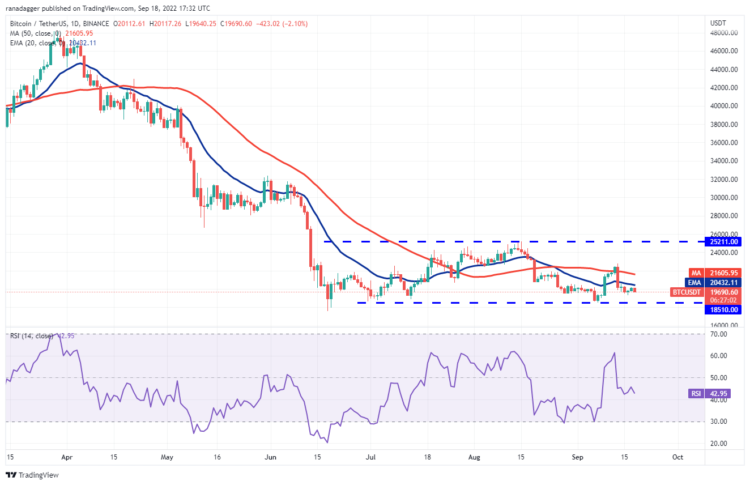
The 20-day EMA ($20,432) has gradually declined, and the Relative Strength Index (RSI) is in the negative zone. This indicates that the sentiment remains negative and traders are selling near the overhead resistance levels.
If the price continues lower and breaks below $19,320, the BTC/USDT pair can fall to $18,510. Buyers are expected to defend this level aggressively.
On the other hand, the 50-day simple moving average ($21,605) is an important level to watch. If the bulls push the price above this level, the pair could rise to $25,211. A break and close above this resistance level may indicate the start of a new uptrend.
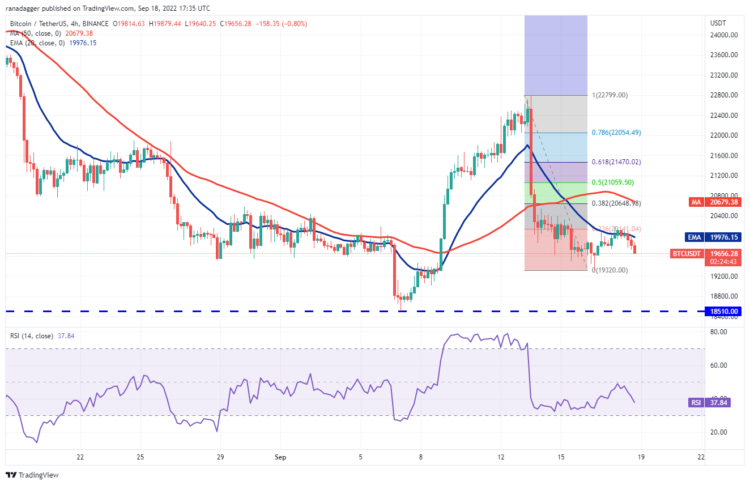
The 4-hour chart shows that sellers are trying to stop a rally at the 20 EMA. This shows that the bears are not giving up their advantage. If this persists and the price breaks below $19,320, the pair may slide to $18,510.
Conversely, if the price rises from the current levels and breaks above the 20-EMA, the recovery may extend to the 50-SMA line. This level may once again act as a resistance level. But if this obstacle is cleared, then the next stop could be the 61.8% Fibonacci retracement level of $21,470.
XRP/USDT
Ripple (XRP) has been “stuck” in the range of $0.30 to $0.39 for days. The price has reached the resistance of the range and if the bulls push the price above this barrier, it can signal the start of a new uptrend.
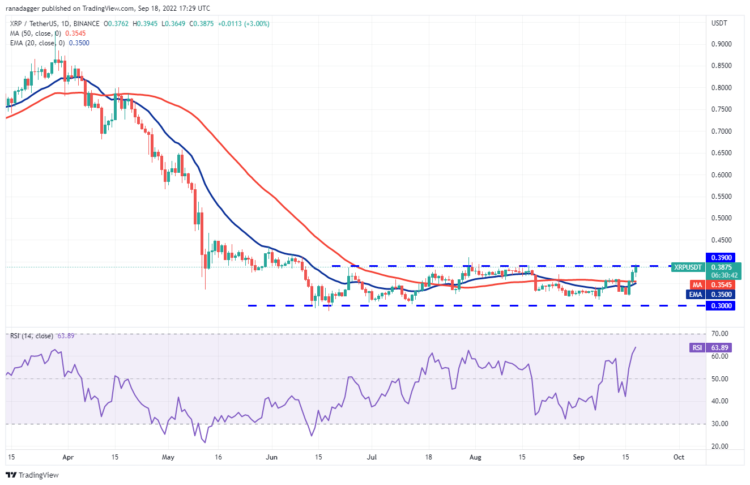
In a range, traders usually buy near the support level and sell near the resistance. If the price drops sharply from the current level and breaks below the moving average, the XRP/USDT pair could extend the consolidation for several more days.
Although the moving averages crossed each other, the RSI has entered positive territory, which indicates that the bulls have a slight advantage. If the buyers push and maintain the price above $0.39, the pair can rise to $0.48.
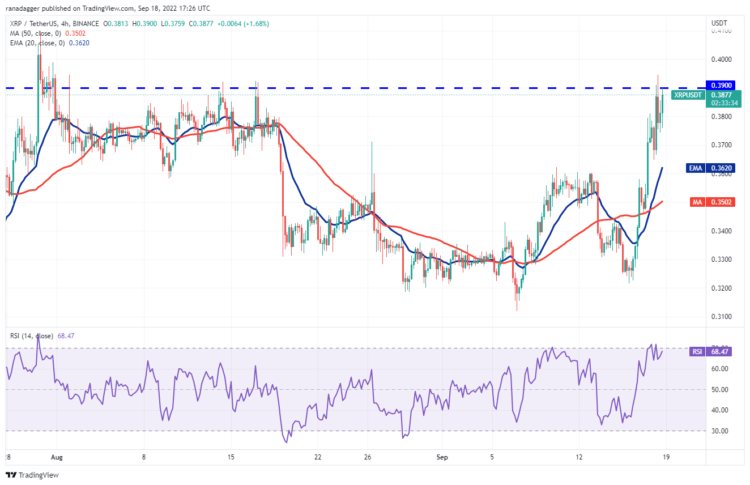
This cryptocurrency pair has surged from $0.32 to $0.39 indicating the strong buying power of the bulls. The 20 EMA has risen and the RSI is in the positive zone, indicating that the path of least resistance is upward.
If the price continues higher and breaks above $0.39, the momentum may increase and the pair may rise to $0.41. This level can act as resistance but if buyers convert $0.39 to support, then the rally can continue.
LINK/USDT
Chainlink (LINK) has been stuck in a large range between $5.50 and $9.50 over the past few weeks, suggesting that buyers are trying to bottom out. The bulls pushed the price above the moving averages and the RSI entered the positive zone, suggesting that the positive momentum may be improving.
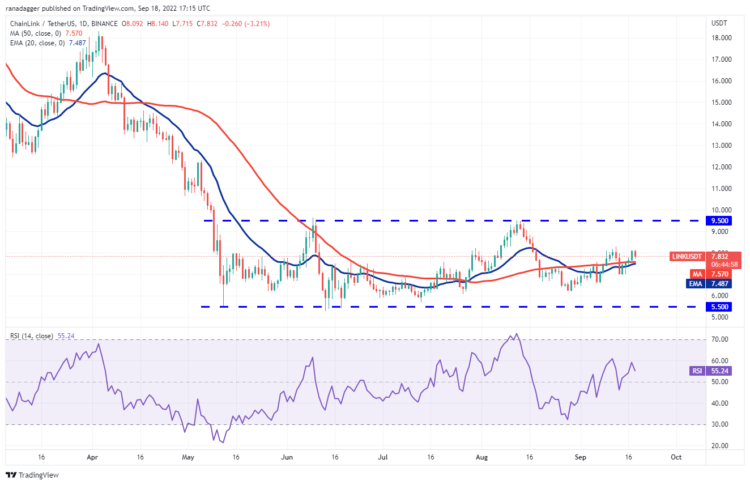
There is a minor resistance at $8.30 and if the bulls push the price above this level, the LINK/USDT pair can rally to the resistance level at $9.50. This level is likely to attract strong selling by the bears but if the bulls break this barrier, the start of a new uptrend may appear.
Moving averages are important to support to watch in terms of downsides because if they “capitulate”, selling pressure may increase. That could cause the pair to start falling to $7 and then to $6.20.
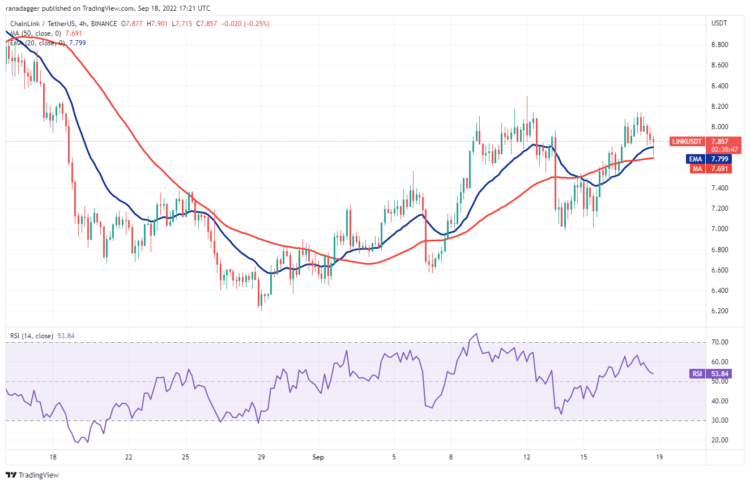
Buyers are trying to defend the moving averages on the 4-hour chart. That could start a rally towards overhead resistance of $8.20. If the price rises above the overhead resistance, the pair can rise to $9.
If the bulls are unable to push the price above $8.20, the bears have a chance to push the pair below the moving average. The advantage seems to be in favor of the bears. First, the pair can fall to $7.50 and then to $7.
EOS/USDT
The bears dragged EOS below the 50-day SMA ($1.44) on September 15 but they were unable to break support at $1.34. This indicates that the bulls are buying when the price falls and are trying to make a low near $1.34.
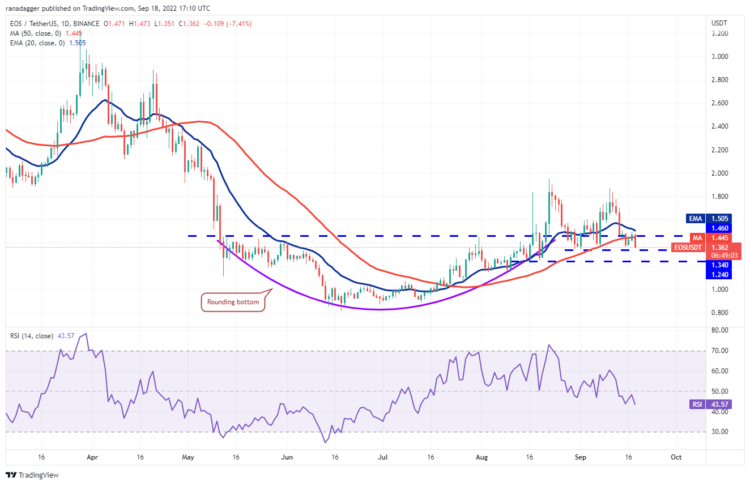
A small negative is that the bulls are facing stiff resistance at the 20-day EMA ($1.50). This shows that the bears have not given up and are trying to gain control. This conflict between bulls and bears is likely to be resolved with a strong breakout.
If the price breaks through the 20-day EMA, the momentum may increase and the EOS/USDT pair may rally to $1.86. Also, if the price falls and breaks below $1.34, the pair can fall to $1.24. A break below this support level may cause the pair to drop to $1.
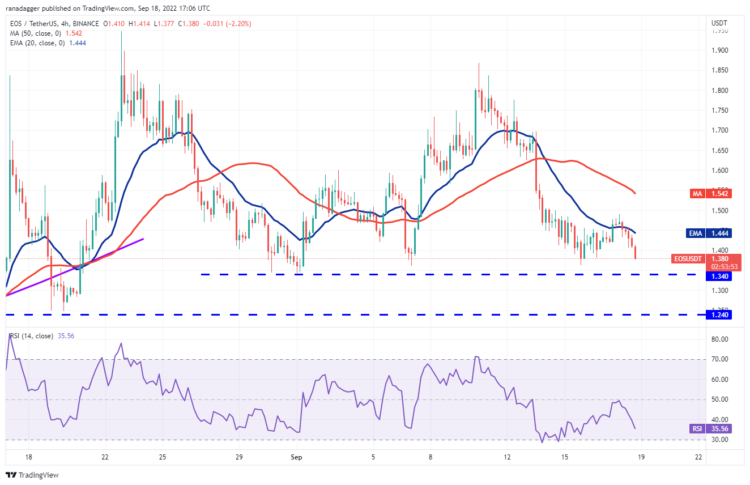
The rally leveled off near $1.50, indicating that the bears continued to sell. The bears will try to further strengthen their advantage by dragging the price below the strong support of $1.34, but that may not be so easy. Attempted buyers defended the $1.34 level
. If the price recovers and breaks through $1.34, the bulls can push the price above the overhead resistance of $1.50. If they can do that, a rally to $1.70 and then $1.86 is possible.
XTZ/USDT
Tezos (XTZ) broke below the 20-day EMA ($1.57) on September 13 but the bears were unable to pull the price to the support line of the symmetrical triangle pattern. This shows that buyers are accumulating when prices fall and are not waiting for a deeper correction. This increases the likelihood of recovery in the short term.
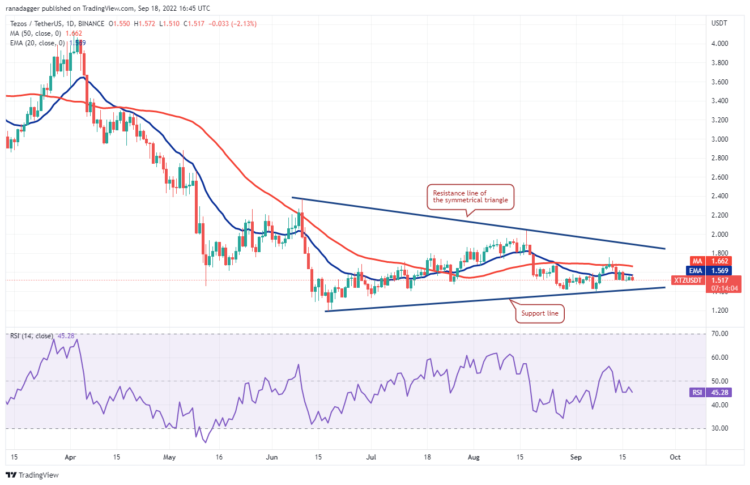
If the price breaks through the 20-day EMA, the XTZ/USDT pair can rise to the 50-day SMA ($1.66). This level has served as a strong resistance level on the previous two occasions, so it is an important level to watch. If the bulls break through this barrier, the pair may try to recover to the resistance line of the triangle pattern.
A break above the triangle will signal a potential trend change. After that, the pair can rise to $2 and then to $2.36.
Meanwhile, the bears are likely to have other plans. They will try to stop the recovery at the moving averages. If the price falls from the current level and slides below the $1.50 to $1.40 support zone, then the June low at $1.20 can be reconsidered.
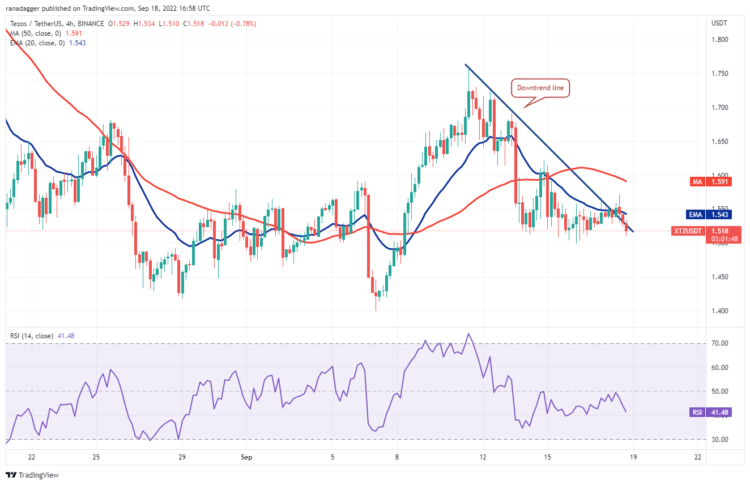
The 4-hour chart shows that the bulls have defended the $1.50 support level and pushed the price above the downtrend line, but they are unable to sustain the higher levels. If the bears fall below $1.50, the pair can fall to $1.40.
On the other hand, if the price bounces off the $1.50 support level again, it indicates that the lower levels continue to attract buyers. The bulls will then try to push the price above the moving average and test the resistance at $1.62. If this level “gives way”, the increase can reach $1.70.
Conclusion
18% are predicting the outcome of the upcoming meeting at 1%. Although the majority is still leaning towards the 0.75% result, the market will still experience large short-term fluctuations until the Fed officially announces the interest rate.
If the result is 0.75%, the market is likely to go green again, and it will be tragic if the 1% scenario occurs.
The results of the upcoming Fed meeting will be updated by us as soon as possible on the ecoinomic.io, which is expected to be announced on September 21, 11 pm Cali USA ![]() time.
time.


