Advertisement
According to data collected from Tron blockchain explorer, Tronscan, the total number of transactions on the TRON network has reached and surpassed $4 billion. Offering lower transaction fees at faster speeds than Ethereum [ETH] is one of the factors contributing to the popularity of this network.

Stability indicators
The TRON network ranks sixth among the most valuable Smart contract platforms. Tron’s market valuation is also at $6 billion, behind Ethereum, Cardano, and Polkadot.
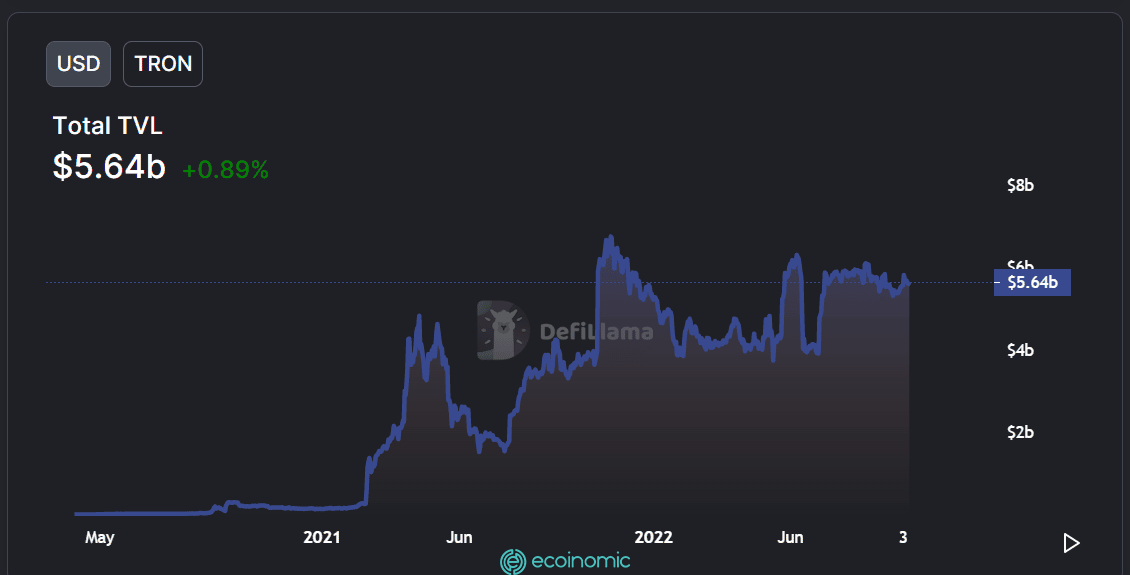
Moreover, the data obtained shows that the network has a Total Locked Value (TVL) of more than $5.6 billion, an increase of 0.89% in the last 24 hours.
TVL dropped to about $3 billion in June before rising above $5 billion and staying the same in recent months. This is depicted in the image below.

TRX price is in good shape
Observing the price chart on the daily timeframe, it can be seen that the TRX has reached resistance at the $0.0658 area, where the 50 Moving Average (MA) and the 200 MA both act as resistance levels.
A descending triangle can be seen using trend lines and using the price range tool, it can be seen that the price has fallen by more than 37% since the beginning of the fall. The support range is also between $0.0599 and $0.0576.

The breakout above the MAs has acted as resistance, especially the long MA signals the start of a potential uptrend. After breaking through the $0.0658 barrier, TRX can perform a test of the level to which the descending triangular trend begins. This would be at $0.0894, up nearly 37%.
The low volatility of the asset is also reflected in the narrowing of the Bollinger Band (BB). According to the confirmed observation of the MA, a breakout on the Bollinger Bands will open a bullish rally for the asset.

With an opening price of $0.0623, TRX was up more than 2% during the trading time and was trading at $0.063. The Relative Strength Index (RSI) shows the line above the neutral line indicating an uptrend in the daily time frame. It can also be observed that this line has an upward inclination, indicating the possibility of moving to the overbought zone.
If the current uptrend on the chart is maintained, a break of the short-term MA resistance level is possible. At this point, investors should take precautions. Crossing the short MA above the long MA may lead to an opportunity to buy the asset.
See also: Bitcoin and Ethereum prices – Fear and Greed Index signals “extreme risk”


