Advertisement
What is resistance?
Resistance (zone of resistance or resistance level) is the price level at which the seller reinforces selling, making it impossible for the price to increase. The number of sellers is greater than the number of buyers and limits the upward momentum of the price, causing the price to stop rising and turn bearish.
What is support?
Support (zone of support/support level) is the area where the price will reverse upwards and end the downtrend. In this price zone, the buying force will be more than the selling force as traders expect the price to rise.
When does support become resistance or the opposite?
In the future when the price falls sharply, the support zone will become resistance, and in opposition, when the price sharply increases, the resistance zone will become a support zone.
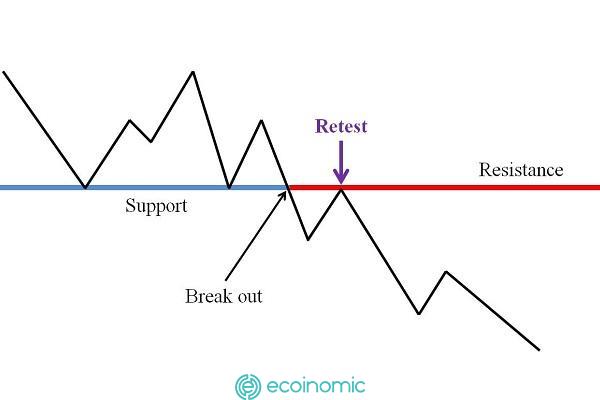
Beginner’s guide to identifying support and resistance zones
Analyzing support and resistance with trendline
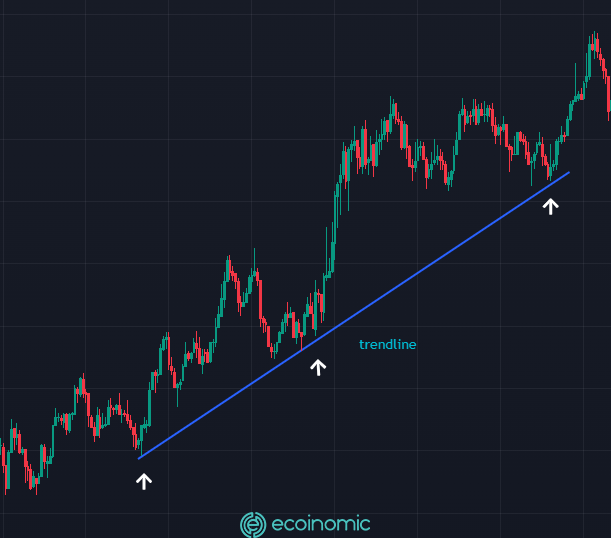
The price of an asset such as stocks, Bitcoin, or XAU… often moves in an upward or downward trend, so it is extremely important to use the trend line to determine the bid or ask price through resistance or support.
As shown below in a downtrend of the LINK/USDT pair, concatenating price peaks over time creates a trendline, where selling pressure increases as the price approach the trendline. This is the temporary resistance in the downtrend.
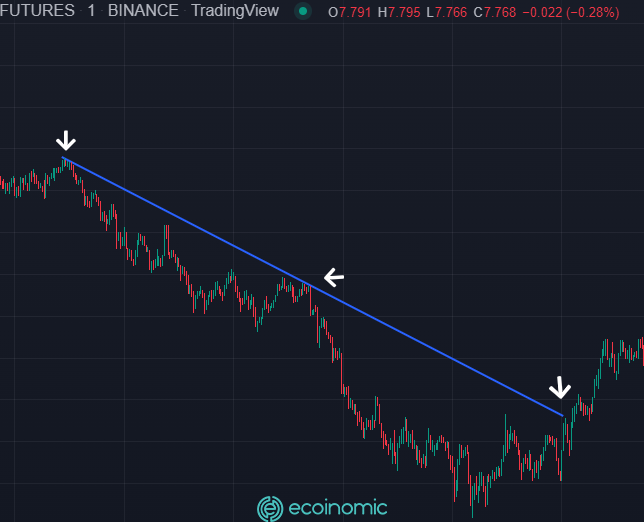
In an uptrend, joining the points with the lowest price level will form a trendline and form a support level. When the price falls to the support zone, the seller will reduce the selling pressure and the buyer will increase the buying pressure, causing the price to reverse and bounce back up.
Related: What Are The Differences Between Investment And Speculation?
Using moving average to find support and resistance
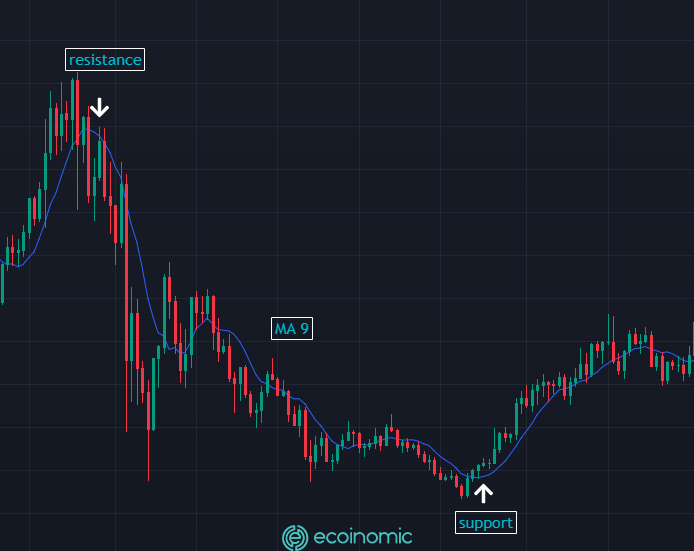
In addition to using the trendline to identify support resistance zones, we can also use the moving average (MA) to find support and resistance points in the short term. MA is used in a short time frame (usually D1) suitable for trading. In the example below, when the MA9 crosses through the candlestick and the price is below the MA9 line makes up the resistance zone.
Conversely, when the price is above the MA9 (the price rises above the 9-day moving average) creates a support zone due to increased buying and returns to the uptrend.
Fibonacci numbers – A simple way to find support and resistance
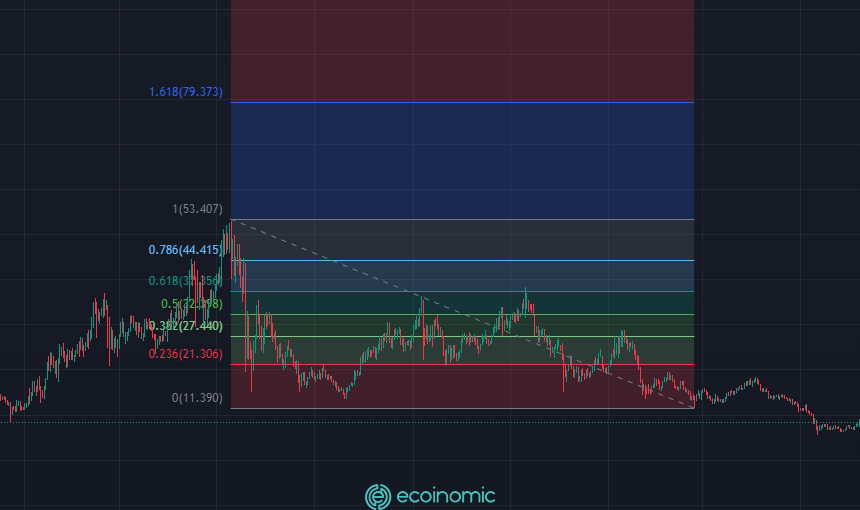
Fibonacci is a golden ratio number sequence that is very suitable for identifying support and resistance levels. The strength of this method is that it is capable of predicting near-accuracy possible reversal points. Just connecting the nearest two highs and lows can draw Fibonacci retracements and predict the future price trend.
Fibonacci levels are potential support resistance levels and investors can rely on them to determine the purchase price or take profits that preserve profits.
Notes on support and resistance
Support and resistance are both psychological levels when trading Prices do not always touch the resistance and support levels that you draw. There is no need to draw too many support and resistance points as this will confuse the eye and not accurately identify resistance and support areas in short timeframes.
Related: What is Trendline? The purpose of using trendlines in technical analysis


