Advertisement
What is a Stochastic Oscillator?
Stochastic is an oscillator used to compare the closing price and price range of a stock or a cryptocurrency over a certain period of time, depending on the user’s settings. This is a momentum indicator that was first invented and applied to technical analysis in 1950. Stochastic is a technical tool developed by trader George Lane.
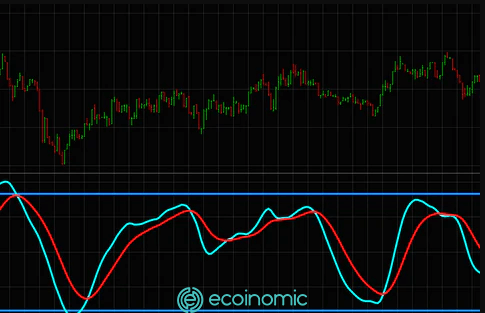
This tool is good in that it determines a good price zone to buy and sell. At the same time, it also determines the next price trend when the price enters the overbought or oversold zone. Through the asset’s price history, the indicator will fluctuate randomly and change around an average price. This indicator will move on a scale of 0 to 100, if it moves in the 80 border area indicating that the price is in the overbought zone, and when the signal indicates that the price is in the 20 border range indicates that the asset is oversold. Stochastic helps measure the momentum of the price, thereby identifying the trend and predicting a reversal in the short term.

How does the Stochastic Oscillator work?
It is not always the price that enters the overbought zone to open a sell order and not every time in the oversold zone we will open a buy order. In fact, there are cases when the price runs in an overbought or oversold area but there is no reversal and continues to move according to the continuing trend. So how do I know exactly when to open a buy and sell order when the price is in the 20- 80 zone?
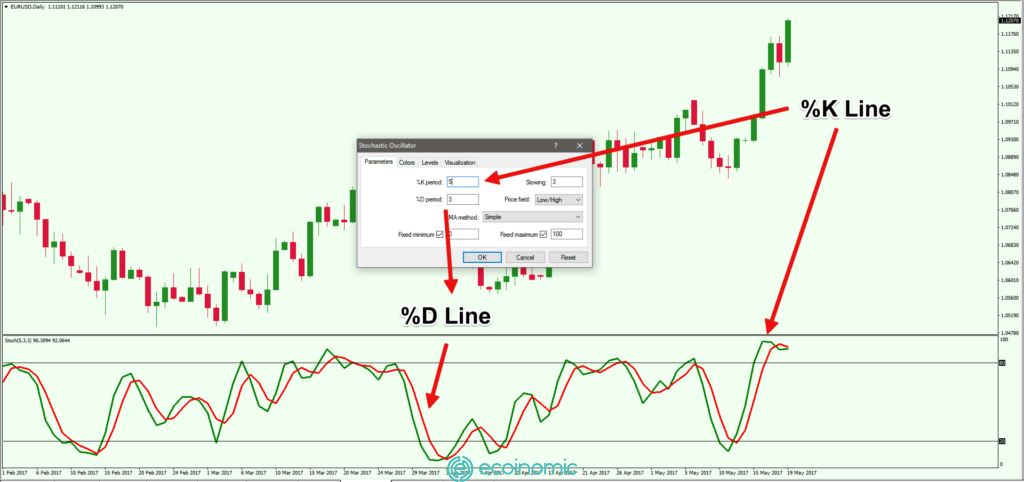
The stochastic oscillator chart consists of 2 lines:
- The line reflects the 3-session simple moving average (%D)
- The line reflects the value of the stochastic per trading session (%K)
When the %K and %D cross at the overbought zone and the %D line is above the %K line, it is possible to consider placing a sell order. Similarly, when the %K line crosses the %D line at the oversold zone and the %D line is below the %K line, we can place a buy order
**The strategy of using the Stochastic Oscillator is detailed later in this article**
The principle of operation: based on the speed and momentum of the price, the momentum is always ahead of the price.
The formula for calculating the Stochastic Oscillator

%D = SMA(%K,n)
- C: Nearest closing price
- L: Lowest price traded in (n) the previous day
- H: Highest price traded in the same time period as L
- n: Period (the period used to calculate)
- SMA: The last 3-session simple moving average
Note: n – is a non-fixed period, n will depend on the timeframe selected on the chart. Specifically, the daily chart has n based on the number of days, for the minute chart, n is calculated based on the number of minutes. Usually n = 14, i.e. 14 days or 14 minutes.
>> From the above formula it can be distinguished:
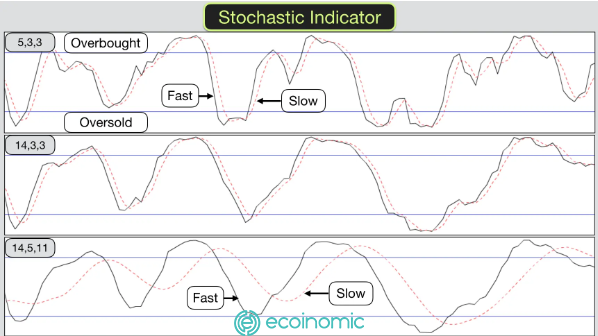
- %K is the Fast Stochastic Oscillator
- %D is the Slow Stochastic Oscillator
The fast Stochastic line is more sensitive than the slow Stochastic line in detecting a change in the direction of the price. We can see that %D is calculated based on the average of %K, so the price movement that %D represents will definitely be slower than the price movement that %K represents.
For example:
- Suppose, if the 14-day high price is 0.07777 $
- The 14-day low price is 0.02790 $
- The closing price is 0.05533 $
- SMA %K of the previous 2 sessions is 86 and 71
%K = [(0.05533 – 0.02790) / (0.07777 – 0.02790)] *100 = 55%
%D = (86 + 71 + 55) / 3 = 71%
So in this case the %K line crosses the %D line and %K is below the %D line, the price is in the overbought zone and cut down => Sell
** Investors do not need to remember this formula because when using the indicator, it has automatically calculated the %K and %D lines according to the reference parameter you set
Three types of stochastic oscillators to know about for new traders
Fast stochastic oscillator
Fast %K is calculated using the basic formula
Fast %D calculated by the average of %K
Slow stochastic oscillator
Slow %K = %D of stochastic fast
Slow %D = SMA of Slow %K
Full stochastic oscillator
Full %K is calculated as the average X phase of Fast %K
Full %D is calculated as the average X phase of Full %K
Trading with the Stochastic Oscillator
Stochastic is true for almost every timeframe from D1, H4 to H1. The transaction is based on the intersection zone of %K and %D.
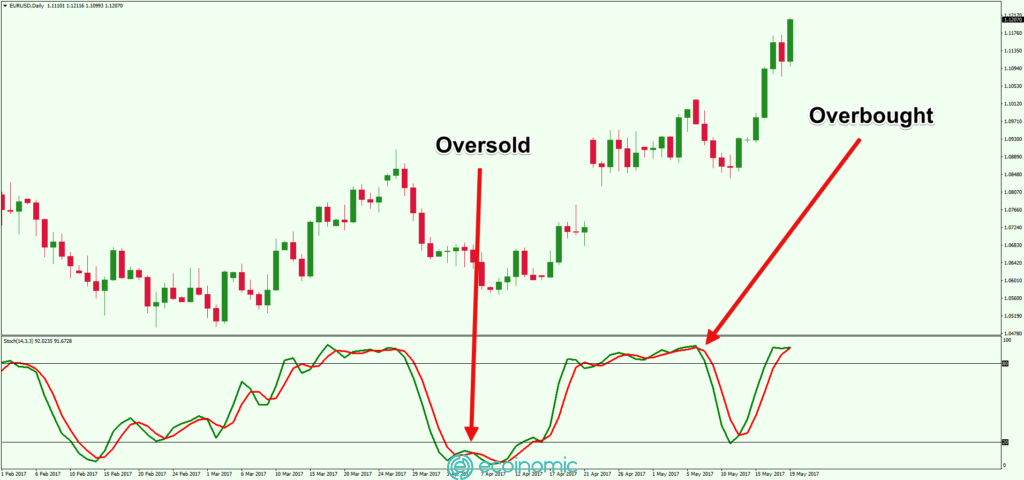
Get the Overbought and Oversold zones right and you will be sure to profit
When the index enters the overbought or oversold zone, it does not mean that the price is overbought or oversold. It means that the price has entered a powerful bullish/bearish momentum. In fact, the Stochastic signal in the overbought zone does not mean that the price will start falling soon after or that the price will rise immediately when in the oversold zone.
In a market with a clear up or down trend, the stochastic may be in the overbought or oversold zone for half a day or a full day, or even more, depending on the time frame you set. To be safe during trading, investors should wait for a reversal signal when the intersection of the %K line and the %D line occurs in the overbought or oversold zone.
Price trend forecasts using Stochastic Oscillator
Uptrend: The %K line is above the %D line. The two lines are located far apart, almost parallel to each other. Observe on the graph when the %K line crosses the %D line is time to buy. They cut each other at what point do we buy at that time.
Downtrend: The %K line is below the %D line. The two lines are far apart. Traders should sell when the %K line crosses below the %D line, so sell at the very moment they intersect to preserve profits.
Price divergence with Stochastic Oscillator
Classical Divergence and Stochastic Oscillator
Divergence occurs when price action differs from the behaviour of the Stochastic indicator. When a divergence occurs between the price and the indicator, the indicator usually gives a signal about the trend of subsequent price movements. Since the price does not reflect momentum, this could be a harbinger of a reversal.
Classical divergence (normal divergence) occurs when the price makes a lower low while the oscillator makes a higher low (buy signal) or when the price makes a higher high while the stochastic creates a lower high (sell signal).
There will be a change in price direction as divergence occurs. To use the oscillator effectively, traders should combine the use of the EMA 200 to identify the main trend. Divergences that occur for pullbacks or short-term corrections should be ignored. It is recommended to trade with divergence only when the main trend is identified.
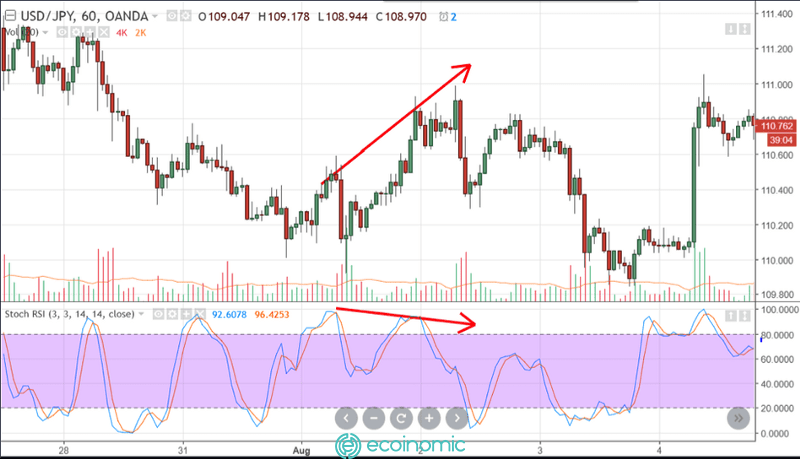
This type of trading is suitable for swing trading at H1, H4 and D1 timeframes. If smaller timeframes are used, then the accuracy of the signal is not high and there is frequent interference.
Hidden Divergence and Stochastic Oscillator
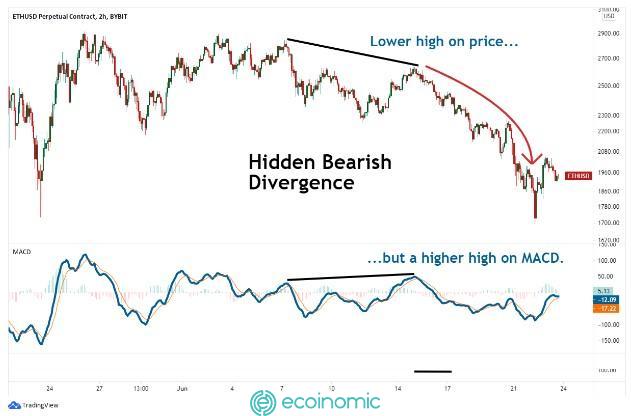
Hidden divergence indicates that momentum is entering the main trend and will continue to follow the main trend. Conditions form a hidden divergence with a random oscillator:
In an uptrend: A higher low is accompanied by a lower stochastic value
In a downtrend: A lower high is accompanied by a higher stochastic value
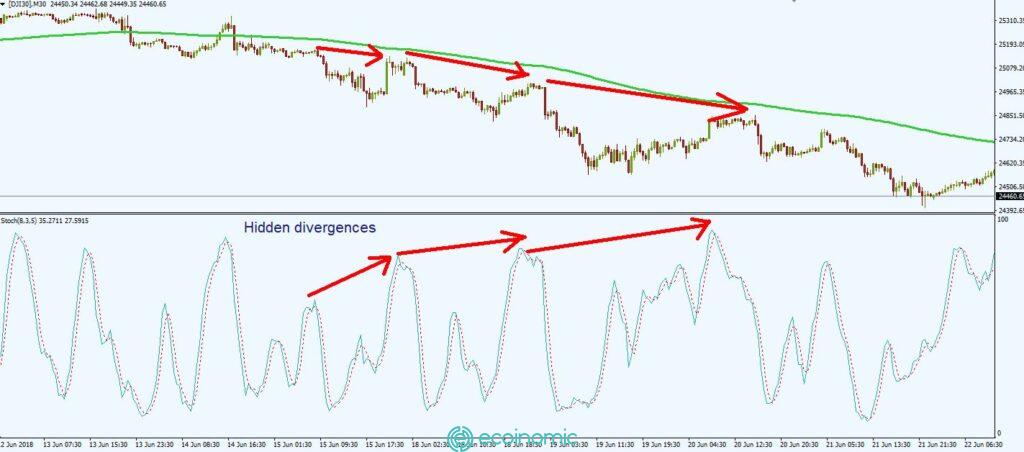
In the chart above, price action shows a bearish momentum, the “bears” are in strength, fully mastering the trend and creating the following highs lower than the previous ones. But the Stochastic indicator is constantly appearing at higher highs, thus forming a hidden divergence.
Trading strategy with Stochastic Oscillator and divergence
- Use in conjunction with the EMA200 to predict the main trend. When the price runs above the EMA200, only open long/buy orders, when the price is below the EMA200, enter short/sell orders.
- Enable the oscillator and set parameters to suit the timeframe and trading method.
- Search and define divergence. If the price is above the EMA200, then the divergence will be on the lower side of the Stochastic indicator. If the price is below the EMA200, the divergence will be on the upper side of the Stochastic.
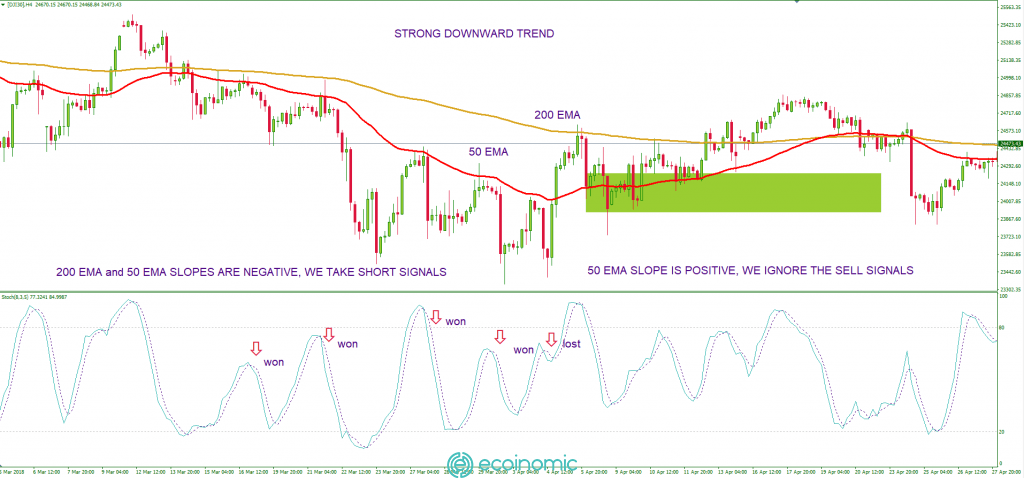
Stochastic Oscillator with Trendline
Identify trend lines (preferentially choose H4 or D1 frames, timeframes smaller than signals are not smooth and often flawed).
Do not trade against the running price trend
Use the crossing point between the %K and %D lines in the overbought and oversold zones to determine the entry point
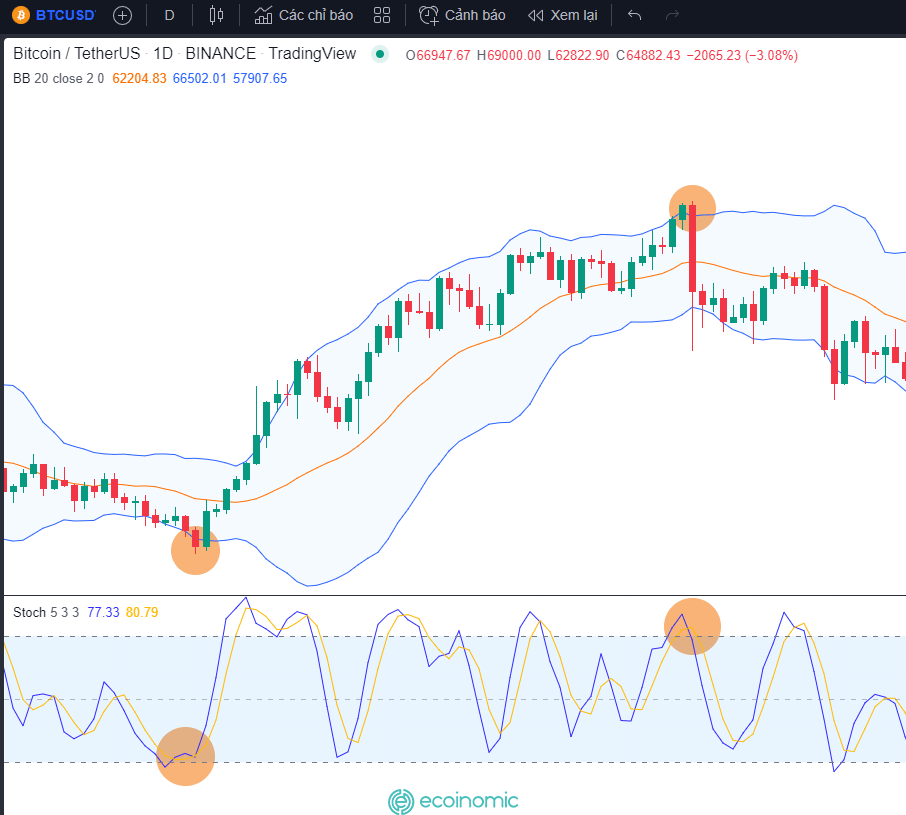
Stochastic Oscillator with Bollinger Bands
Install Stochastic with parameters: 5.3.3
Install Bollinger Bands with standard parameters: MA20, StdDev: 2
Long/Buy entry conditions:
Price crosses or touches the lower band of BB
%K line crosses above %D line
Short/Sell entry conditions:
Price crosses or touches the upper band of BB
%K line crosses below line %D
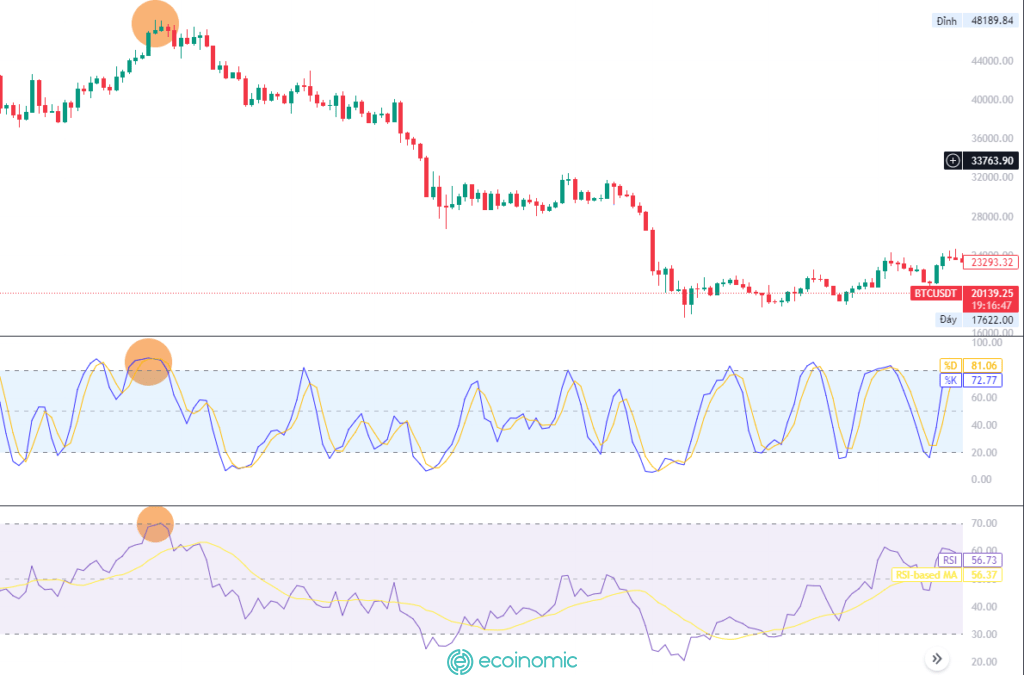
Stochastic Oscillator with RSI
The same
- Both are oscillators that reflect changes in momentum and price
- Forecast signals of overbought/oversold zones (stochastic) and divergence/convergence (RSI)
- Usable for many markets such as stocks, forex, cryptocurrencies
Different
Differences in setting parameters
The standard overbought – oversold zone of stochastic is 80-20, of RSI is 70-30 RSI
RSI does not use moving averages while the oscillator must incorporate an EMA to increase the credibility of the signal
RSI is used to determine support and resistance levels.
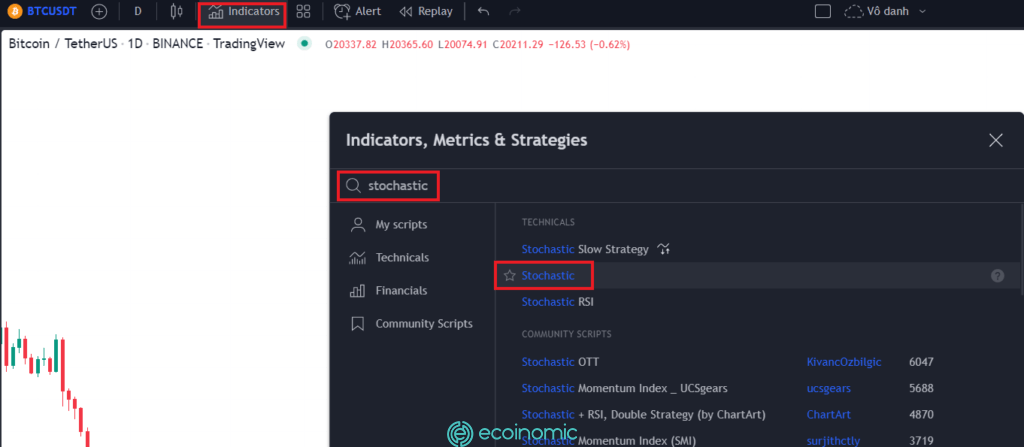
Enable Stochastic Oscillator on Tradingview
Step 1: Open Tradingview, select “Indicators” and type “Stochastic”
Step 2: Set the parameters:
- %K Length (14), %K Smoothing (3), %D Smoothing (3) – this is the most used setting, in addition to the standard setting 5.3.3 or 8.3.3
- Choose blue to represent the %K line, and yellow to indicate the %D line
- Correction of overbought and oversold zones to 80, 20
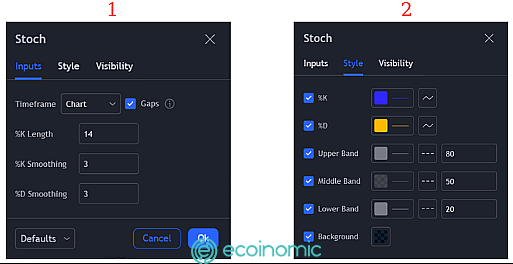
A lot of traders try to look for the perfect parameters to find a way to win the market. In fact, it is not so easy, no parameters are 100% accurate. Investors just need to find the trading style that suits them, and then set the parameters depending on the market and time frame.
Limitations of the Stochastic Oscillator
- It is not effective when used alone, but must combine other indicators such as RSI, divergence, candlestick pattern, trendline, EMA … The use of oscillators and other technical analysis indicators helps to smooth the signal and increase accuracy.
- Stochastic is often used in uptrend or downtrend, not effective in sideway trend because then the signal is noisy and EMA200 is almost flat.
- This indicator is only suitable for scalping and swing trading methods, so it requires traders to have reasonable capital management and order management principles to protect accounts and maximize profits.
>>> Related: What Is Binance Dual Investment?


