Advertisement
What is the Stochastic Momentum Index?
The Stochastic Oscillation Intensity Indicator or Stochastic Momentum Index (SMI) was developed by William Blau. This indicator is closely related to the Stochastic Oscillator. While the Stochastic Oscillator shows a correlation between the closing price and the highest/lowest price range, the SMI shows the correlation between the closing price and the median of the nearest candle’s highest/lowest price range. SMI is calibrated twice by exponential moving average (EMA). This is an indicator that oscillates between +100 and -100 and is smoother than the Stochastic oscillator with the same number of calculated periods. SMI reacts to prices faster and more sensitively than traditional stochastic indicators.
The meaning of the Stochastic Momentum Index indicator
William Blau invented the SMI indicator in 1993 with the aim of improving the signal deviation of the conventional stochastic indicator.
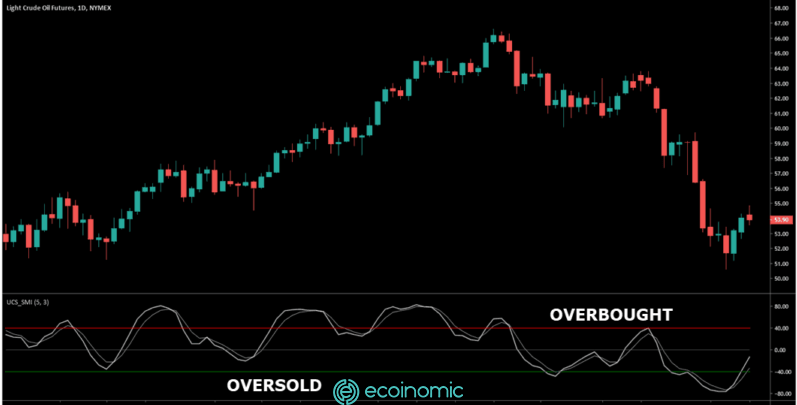
Overbought/oversold: Determine overbought or oversold zones just like the stochastic indicator
Momentum: Indicates the level of buying or selling pressure of trend momentum
Trend: Identify the uptrend, downtrend and sideway trend
False trend: SMI helps to identify divergence, indicates the end of the current trend and recognizes the wrong trend.
How to use the Stochastic Momentum Index
When prices close above the median of the highest or lowest price range for a particular period, the SMI is positive. When the closing price is lower than the median of the highest or lowest price range, the SMI is negative.
Buy when the SMI drops to -40 and then rises above this level. Sell when the SMI rises above +40 and then falls below it. However, before deciding to make any trade based on the overbought or oversold zone, it is necessary to first determine the trend of the market based on indicators such as the r-Squared or Chande Momentum Oscillator. If these indicators give signals that the market is not trending, then trading based on overbought or oversold zones will give the best results. If the market has a clear uptrend, use the oscillator to make a trade in the direction of that trend.
Buy when SMI crosses above the signal line (moving average – MA) and sell when SMI crosses below the signal line.
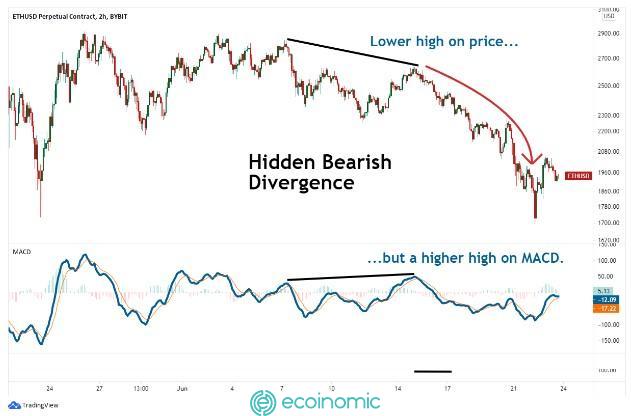
Determines divergence when price makes a series of new highs that SMI does not.
William Blau also noted that the SMI at the D1 timeframe is very sensitive to the movement of closing prices in relation to the highest or lowest price of the day. These parameters make the SMI an indicator that helps identify trends, so SMI helps to better predict the general direction of the market movement.
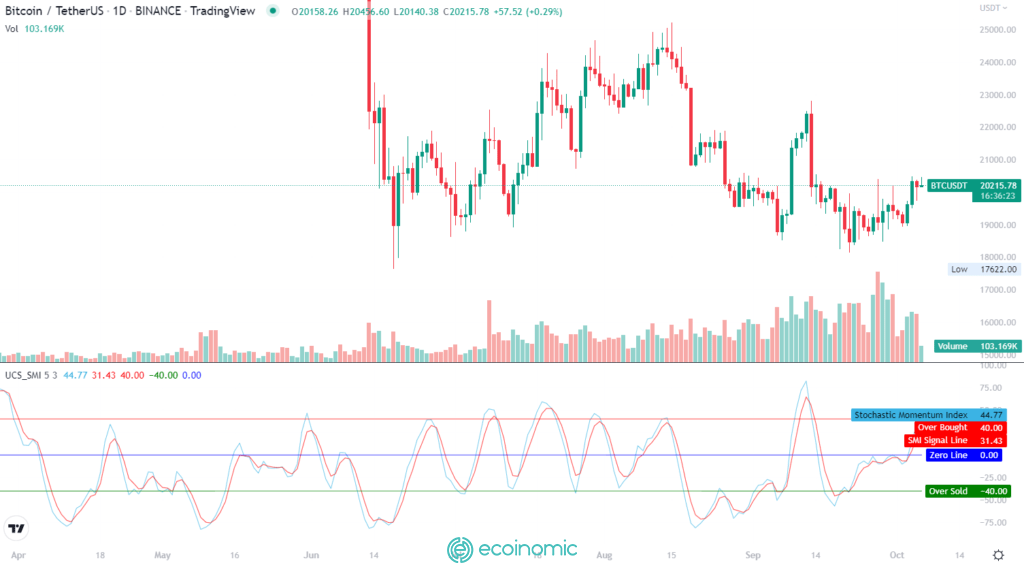
In the chart below, the %K line is the blue line and the %D line is the red line.
How to calculate Stochastic Momentum Index
SMI is calculated as follows:
1. Add the highest and lowest prices in the calculation period
2. Divide the value calculated in step 1 by 2 to get a median price
3. Subtracting the closing price from the median price calculated in step 2, which tells us the difference between the closing price and the median of the highest or lowest price range in n periods.
4. Calculate the EMA of the calculated value in step 3
5. Calculate the EMA of the value in step 4
6. Take the highest price minus the lowest price for the calculation period
7. Calculate the EMA of the calculated value in step 6 (using the same number of periods as step 4)
8. Calculate the EMA of the calculated value in step 7 (using the same number of periods as step 5)
9. Divide the calculated value in step 8 by 2
10. Divide the calculated value in step 5 by the value calculated in step 9
11. Multiply the value in step 10 by 100. This is SMI
See also: What Is Market Cap? Explain Crypto Market Capitalization In 2 Minutes
How to use the Stochastic Momentum Index on Tradingview
Step 1: Open Tradingview and select “Indicators”.
Type “Stochastic Momentum Index” in the search bar and select one of the tools below.
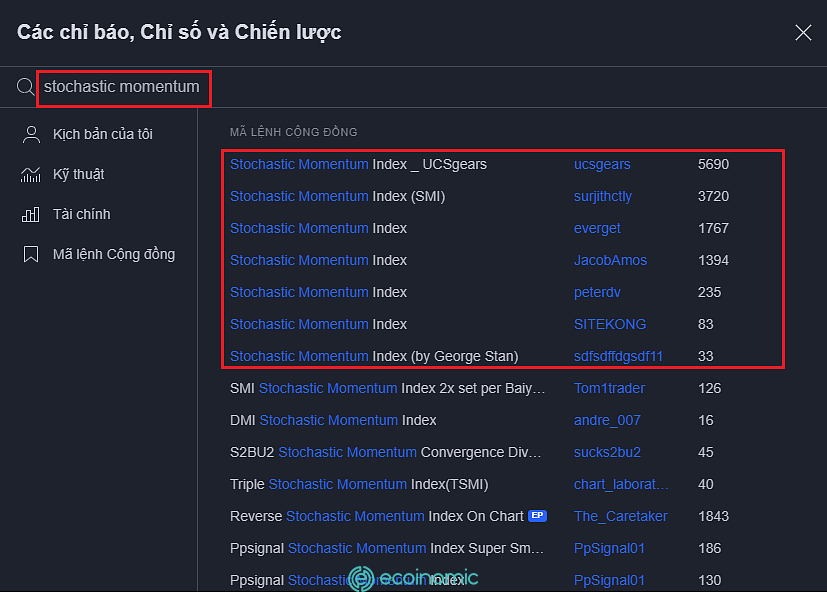
Step 2: By default, the %D length is 3 and the %K length is 5, but investors can adjust these parameters to suit their time frame and trading style.
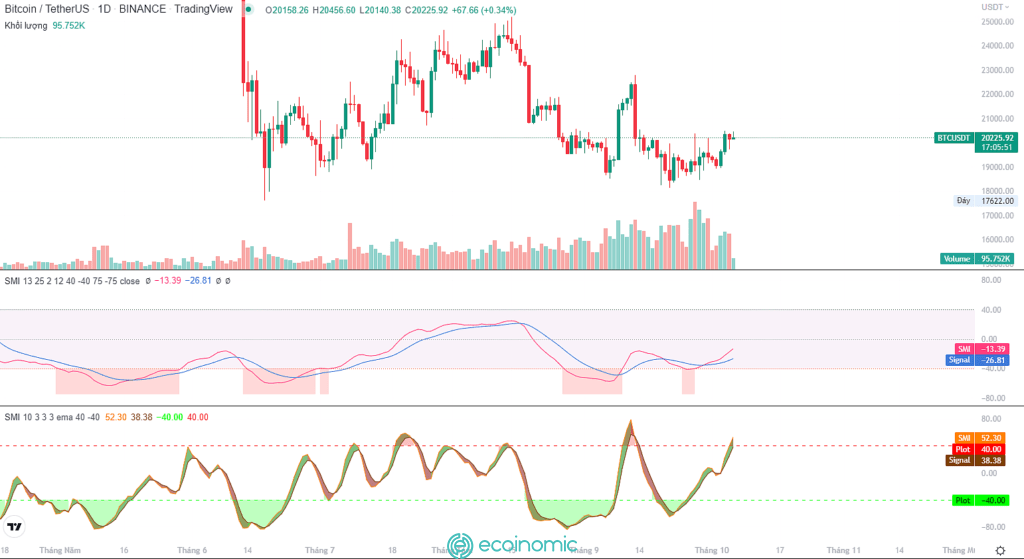
Pros and Cons of Stochastic Momentum Index
Advantages of the Stochastic Momentum Index
Quickly identify price momentum changes
Give clear signals, know exactly the reversal of the trend
Identify the entry and exit points in the market
Disadvantages of the Stochastic Momentum Index
It must be combined with other indicators to ensure that the signal is not erroneous.


