Advertisement
In the previous article, we learned what support and resistance levels are, and how they are broken when investor expectations change. That change leads to a shift in supply and demand and changes the price trend, also known as the trendline. In this section, we will learn about the trendline. If you are new to the market and do not understand anything about support and resistance, learn it here
What is Trendline?
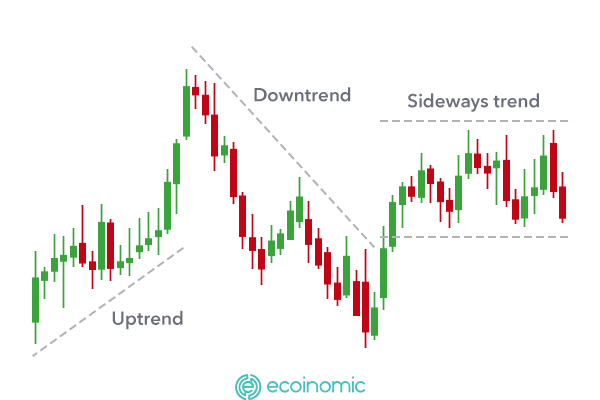
Trendline represents the price trend of an asset. The price trend represents a constant change in the direction of the price (a change in investor expectations). Trendlines differ from resistance and support in that trends represent change and resistance and support zones are barriers to change. A trendline is a straight line that connects the top to the top or the bottom to the bottom.

The purpose of using trendlines in technical analysis
The trendline is one of the simplest indicators that anyone who first enters the trading path must learn and carefully study how to use. Because it is a signal that helps predict trends in price action. Trendline helps analysts determine which trend an asset’s price is moving in. From there, find resistance zones and support to enter and place reasonable orders, helping to preserve profits and limit risks.
See also: What Is Dow Theory? Technical Analysis Platform
Types of trendlines
The trendline in the uptrend
The uptrend, also known as an uptrend, has a higher back top than the previous one, the back bottom is higher than the previous one. When connecting the bottoms together, a straight line is created upwards. We can understand that an uptrend occurs when support levels move higher when bulls are prevailing and pushing asset prices higher.
The trendline in the downtrend
A downtrend is formed when the following peaks are lower than the previous one. We can understand that a downtrend occurs when resistance levels move to lower levels – when bearish market expectations (the bears) are prevailing and pushing prices lower.
The trendline in the sideways
A sideways trend is a state in which prices move at a small range around a certain price area, the tops and bottoms are usually sideways and when connecting them, a horizontal line is obtained. This stage is called the consolidation phase, the price goes sideways, so there will not be much movement.

How to find a trendline
To draw a trendline is quite simple, you just need to connect the tops and bottoms together to create a trendline.
- Uptrend: connecting the bottoms together and the back bottom is higher than the previous bottom
- Downtrend: connecting the peaks together and the latter lower than the previous one
- Sideways trend: pick the highs or bottoms and join them together
See also: What Is Market Cap? Explain Crypto Market Capitalization In 2 Minutes
Instructions for drawing trendlines on tradingview
Method 1: Draw a trendline by joining the tops or troughs
Step 1: At the interface of tradingview, select the diagonal line on the left-hand side. When clicking on this character will see its name as a trendline
Step 2: Observe the movement of the ongoing price trend to select the tops (if the trend is down) or select the bottoms (if the trend is up). Then join them together and wait for the next price movement to consider the exit point, entry point

Method 2: Use indicators to draw trendlines for newbies
Step 1: In the “indicators” section, in the search box type “trendline” and select any indicator
Step 2: The indicator will automatically draw trendlines according to the trend of the price movement at that time

In the example above, when using the available indicator, you will be supported with entry points and know when to take profits, thereby helping to better manage risk and avoid heavy losses when the price does not follow the trend you predicted.
What are some notes when using trendlines?
To draw a trendline, you need at least two peaks or two bottoms, but to create an accurate trendline, you need 3 consecutive peaks or 3 bottoms that satisfy the conditions above.
The reliability of the trendline depends on its slope. The steeper the trendline, the lower the accuracy of the trend you predict and the likelihood of a reversal.
If the price touches the trendline several times without breaking, the price trend continues and becomes stronger and stronger
Conclusion
Because individual traders use technical analysis more often than fundamental analysis, trend lines are especially popular in cryptocurrency trading. According to technical experts, price action and analytical tools such as trendlines are the most reliable ways to gauge traders’ sentiment.


