Advertisement
What is divergence?
A divergence is when the price moves in one direction but the oscillator moves in the opposite direction. The direction here is determined by the tops and bottoms formed on that indicator and at the same time uses the peaks and troughs created by the price movement. In summary, divergence occurs when the price trend of the volatile asset is not consistent with the indicator’s trend.
Usually, divergence is used in combination with 1 of the 3 oscillators: MACD, RSI and Stochastic. However, in some special cases, it is also applicable to other oscillators such as CCI and ADX.
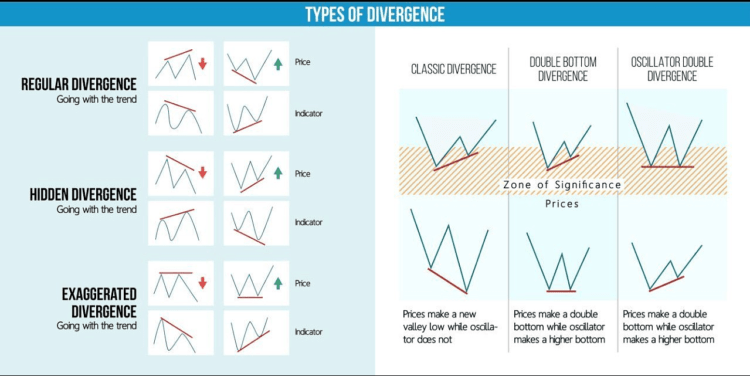
Divergence must be used in tandem with oscillators because it shows the market’s momentum, thereby relying on the formation of tops and troughs to determine the next market trend. Indicators identify the trend better than the price.
Types of divergences
There are 3 types of divergences: Regular divergence, hidden divergence and exaggerated divergence.
Each type is subdivided into bullish divergence and bearish divergence.
Regular Bullish Divergence
This type of divergence usually occurs when the market is in a fairly long downtrend and the price makes a lower low than the previous bottom, but on the indicator, it makes a higher low than the previous bottom. Showing a bottom with very weak momentum is a signal of a strong potential for price reversal. However, divergence is only a signal to determine the change of trend. It is still necessary to add confirmation signals from other indicators or price action to find to determine a reasonable entry.
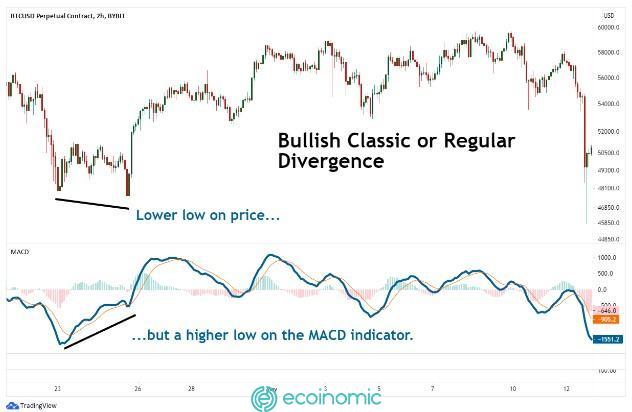
Regular Bearish Divergence
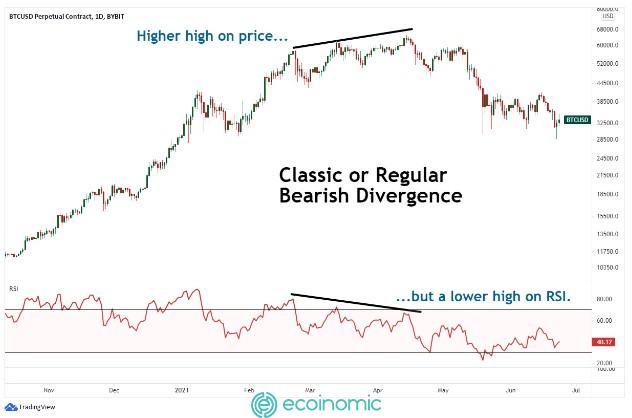
Bearish divergence usually occurs when the market has strong bullish momentum, different from the previous period, creating a higher high than the previous one. At the same time, the indicator will give the opposite signal, the following peak is lower than the previous one, indicating that the momentum is starting to go down and the market is likely to reverse extremely strongly. When this is the case, investors should sell, and then wait for other clearer signals to confirm the entry point.
Bullish Hidden Divergence
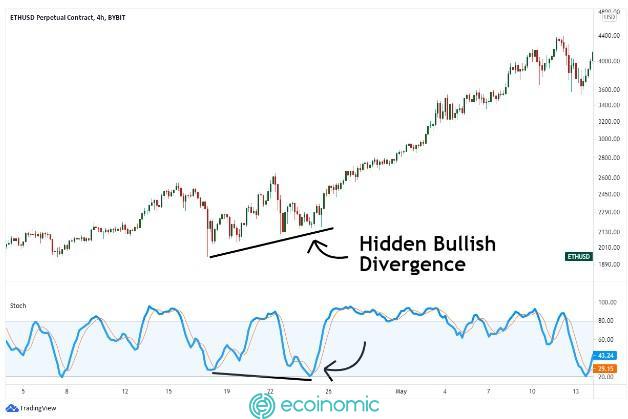
The Bull Market structure is formed with the latter bottom higher than the previous one. However, the indicator signals a lower low, indicating that at this bottom the momentum is still very strong and there is enough strength to continue maintaining the ongoing uptrend. In this case, this is not a reversal signal, so investors need to trade with the trend.
Bearish Hidden Divergence
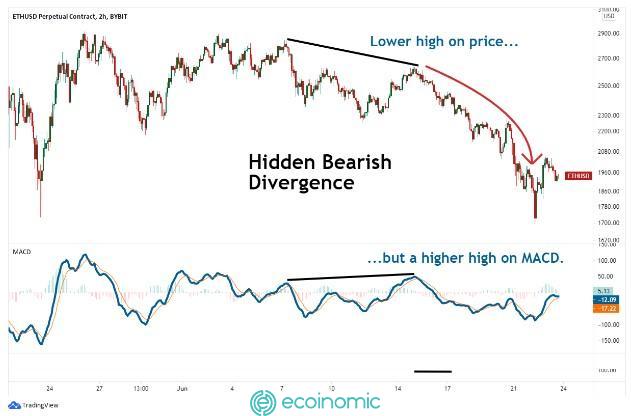
The market is trending down, but the momentum indicator gives a bullish signal with a higher high. A divergence signal appears here, confirming that the downtrend is still continuing. At this point, the trader should not make any trades but should wait for other signals to confirm the accuracy.
Bullish Exaggerated Divergence
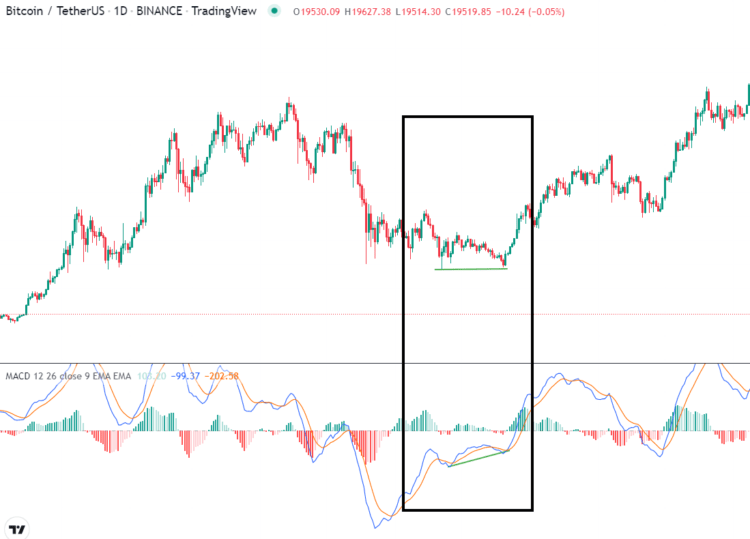
Bullish exaggerated divergence occurs when the price line forms two equal bottoms. On the other hand, technical indicators are forming two skewed bottoms. In the chart below, we can easily see that the price line has formed two nearly equal bottoms, however the MACD has moved to form a higher low than the previous bottom. When experiencing an exaggerated bullish divergence like in this example, it means that the market will reverse and move the trend from down to up.
Bearish Exaggerated Divergence
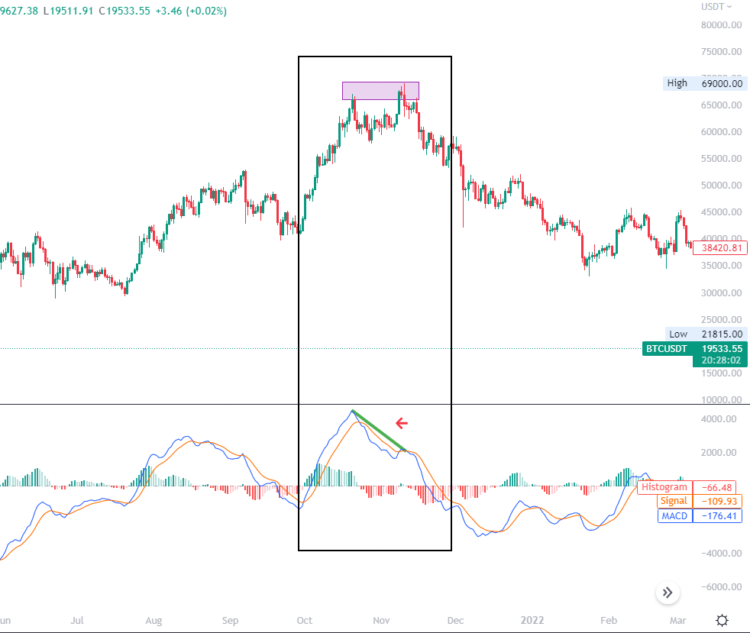
Unlike Bullish exaggerated divergence, a bearish divergence occurs when two peaks are equal but the oscillator creates two deviant peaks and the latter is lower than the former. In the illustration below, the price makes two peaks that are close to each other and equal. In the MACD indicator, the signal line and the MACD line intersect to form two peaks but the latter is lower than the previous one. This shows that the market is entering a downtrend. The appearance of a bearish exaggerated divergence indicates that the market has begun a period of sharp declines, at which point investors should sell rather than buy.
Notes when using divergence
- Divergence is only a warning signal, not an entry signal
- Depending on the applicable indicator, divergence signals will be used differently.
- When the market is highly volatile, divergence signals will be incorrect.
- It is necessary to combine the use of other technical indicators to increase the accuracy of the signal.
Divergence on Tradingview
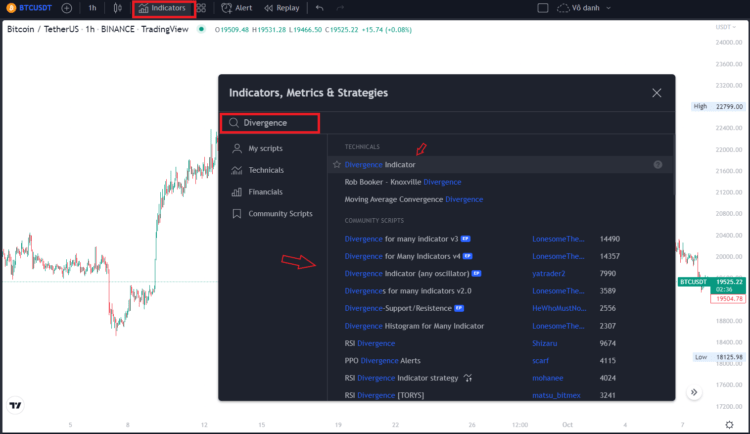
Step 1: Log in to your Tradingview account
Select “Indicators”
In the search box type “Divergence”
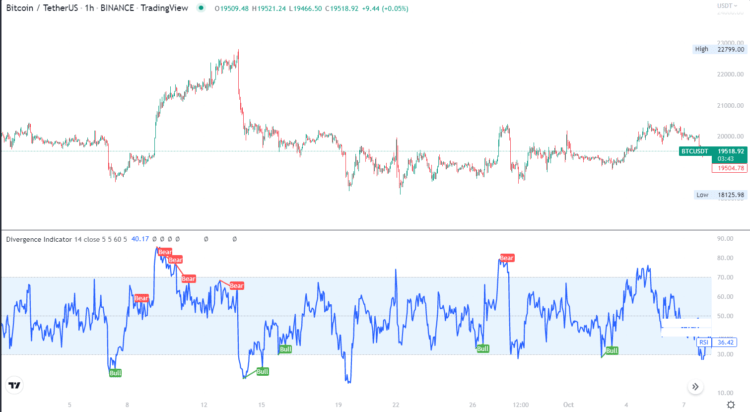
Step 2: This indicator shows Bull and Bear indicators corresponding to the Buy – Sell zone
How to apply divergence in crypto trading
The example below is the BTC/USDT trading pair on Binance at the m45 timeframe.
» » If you don’t have a trading account on Binance, click here for detailed instructions!
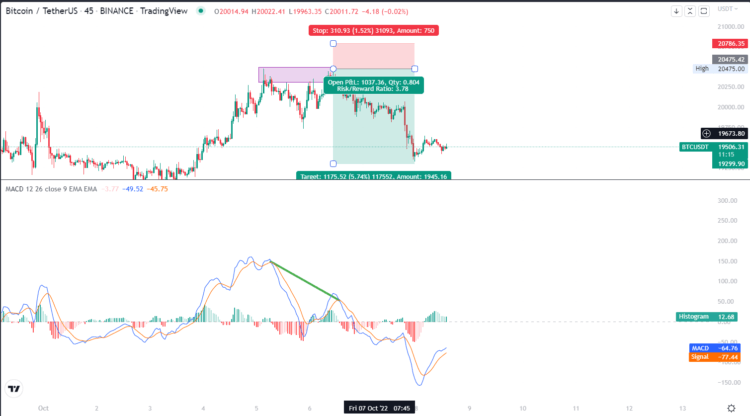
After a while, the price of BTC rose from more than $18,000 to more than $20,000 encountered resistance and formed two temporary highs in the $20,473 price zone. Meanwhile, the MACD indicator has created two peaks with a large difference, the latest peak is much lower than the previous one, and the MACD line crosses below the signal line, signalling a downtrend is forming.
In this zone, a bearish exaggerated divergence has formed. Then if the investor opens a Short position with entry and R: R ratio with reasonable leverage will make a great profit.


