Advertisement
What does MACD mean?
MACD (Divergence/Convergence of Moving Averages) is a trend-following oscillator that indicates the relationship between two moving averages of the price. Gerald Appel developed MACD and is also the author of Systems and Forecasts. MACD is the difference between the 26-day exponential moving average (EMA) and the 12-day EMA. The 9-day EMA is called the signal line, and it is drawn together with the MACD to identify buy or sell signals.
Appel defined the EMA as a percentage so he mentioned three moving averages of 7.5%, 15%, and 20%, respectively.
MACD indicator structure
MACD is created by 3 main components:
- MACD line: is the difference between the long-term EMA minus the short-term EMA
- Signal: is the 9-day EMA of the MACD line
- MACD Histogram: indicates the actual value of the chart, including blue and red colours representing bullish and bearish price zones
MACD classification
MACD consists of two types, negative MACD and positive MACD.
- A positive MACD appears when the 12-track EMA is above the 26-track EMA and they cross from the bottom upwards.
- A negative MACD appears when the 12 EMA is below the 26th EMA and they cross from the top down.
How does MACD work?
MACD works
MACD is calculated by subtracting the 12-day moving average price from the 26-day moving average. The result of this subtraction gives an indicator that hovers around 0. A MACD greater than 0 means that the 12-day moving average is higher than the 26-day moving average. This is a sign of a Bull Market because it shows recent investor expectations (i.e. 26-day moving average). This also indicates an upward movement signal of the supply and demand curve. A MACD falling below 0 means that the 12-day moving average is lower than the 26-day moving average, and also indicates a downward movement signal of the supply and demand curve.
MACD calculation formula
Step 1: Calculate the 26-day EMA of the closing price
Step 2: Calculate the 12-day EMA of the closing price
Step 3: Take the EMA (26) – EMA (12), the result is the MACD line
Step 4: Calculate the 9-day EMA of MACD and we get the Signal line
Step 5: MACD Histogram = MACD – Signal
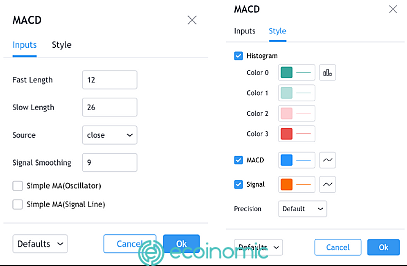
26 periods, 12 and 9 are usually set by default.
Due to its origin in the EMAs, MACD is considered a slow indicator, it is only suitable for stock trading when it is in a narrow range and the volatility is not too high. When using MACD in trading coins you will see that sometimes the signal is noisy and it has a certain lag compared to other oscillators.
See also: What is the Wyckoff method?
Trading strategy with MACD
There are three ways to trade with MACD as follows: based on crossings, divergences and overbought or oversold zones.
Line Crossovers
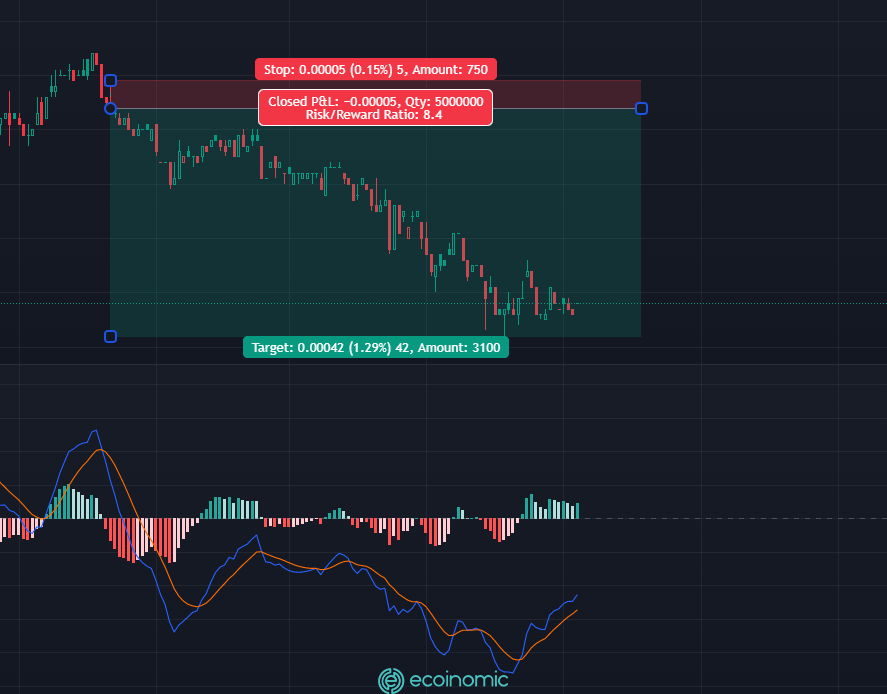
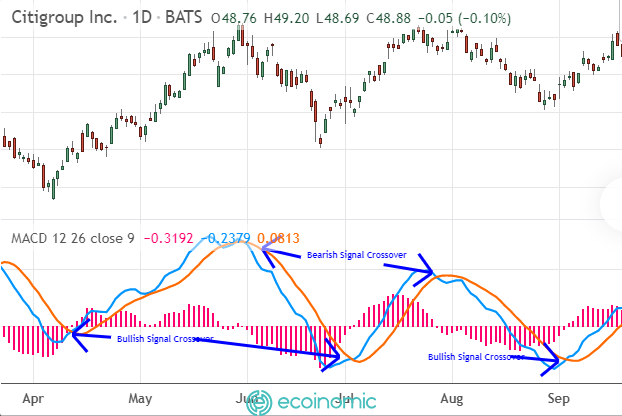
The cross between the MACD line and the Signal line is chosen as a trading signal. A Buy signal appears when the MACD rises above the signal line. Similarly, sell when the MACD falls below the signal line. In addition, traders can also buy or sell when the MACD rises above or falls below zero (Zero Line Crossovers).
Overbought/Oversold
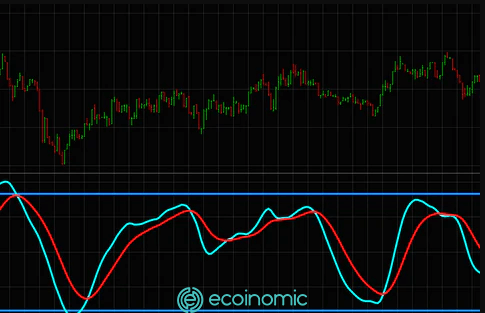
MACD is useful when used as an indicator of overbought and oversold zones for the price of an asset. When the multi-day moving average suddenly widens the distance from the multi-day moving average (i.e. MACD rises), then the price rises too much and will soon return to a fair price. The overbought or oversold zone according to the MACD of each asset is different.
Divergence
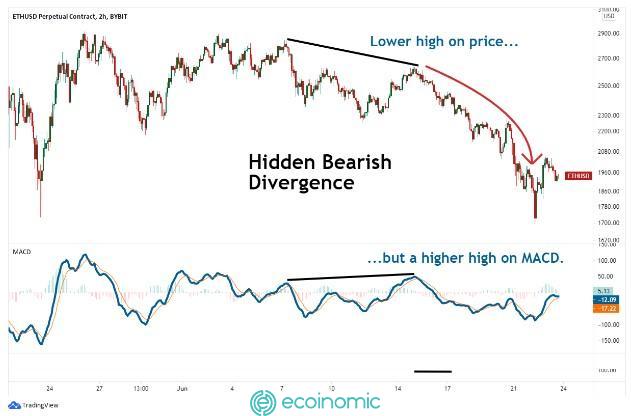
One sign that the current trend is coming to an end is when the MACD makes a divergence with the price line. A bearish divergence occurs when the MACD creates a new bottom and the price line does not. A bullish divergence occurs when the MACD establishes a new peak and the price line does not. Both these upward and bearish divergences give the most reliable signals when they occur in the overbought or oversold zone.
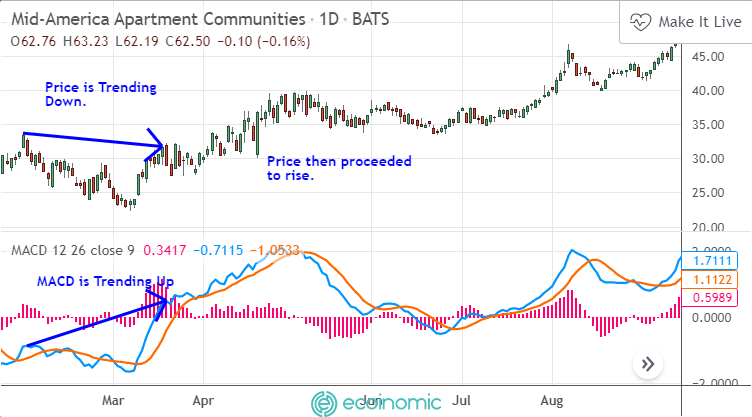
The importance of Zero Line
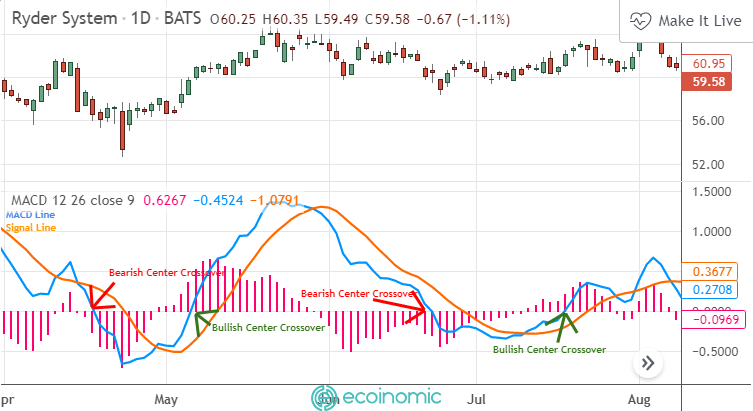
The zero Line, also known as the centre line, is a line with a value of 0, which is considered a marker to confirm the reversal signal of the price line. When the MACD line and the Signal line intersect and run below the 0 levels, signalling a fall in the price, it is not recommended to buy. On the contrary, when the MACD and Signal line intersects and run above the zero line, it means a bullish reversal signal, it is recommended to stop selling and buy.
Based on the centre line, it is possible to identify the overbought and oversold zones through the distance of the zero line from the signal and MACD lines. Buy and sell signals are generated by the crossover above and below the 0 lines.
See also: What Is Divergence? How To Apply Divergence In Crypto Trading
MACD on Tradingview
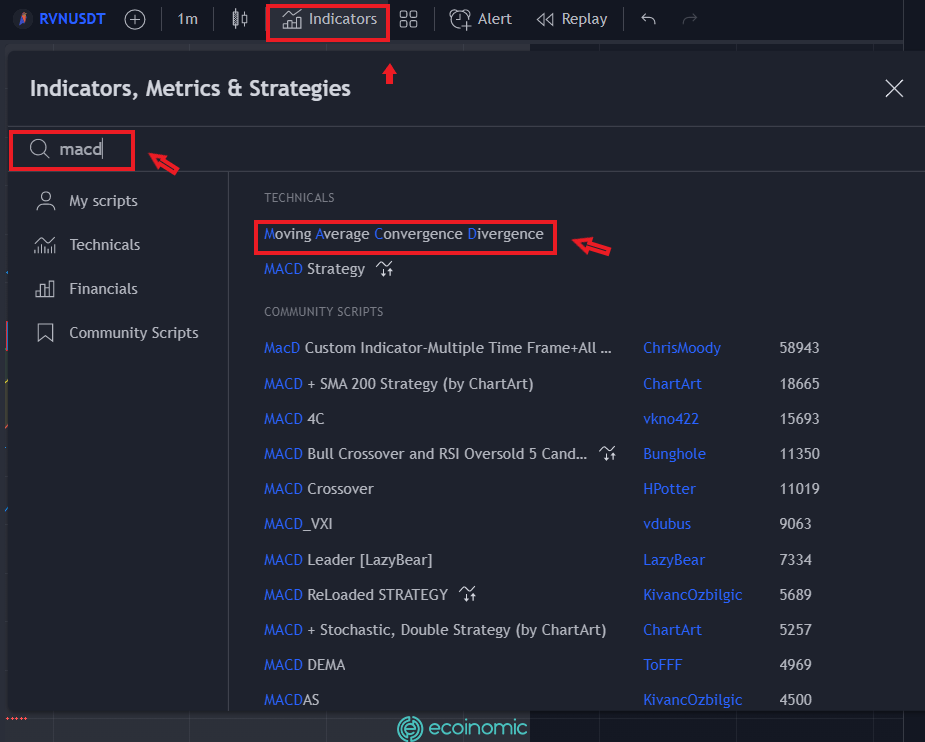
Step 1: At the home page select “Indicators”, then type MACD in the search bar
Enable MACD indicator on TradingView
Step 2: Set the necessary parameters (if necessary)
Conclusion
MACD is a familiar indicator that is easy to use, but it is considered slow because the data is calculated based on the past price action of a coin. Therefore, the MACD indicator always gives a signal lag compared to the actual price. It’s only really useful when you use it to predict trends and future reversals.

