Advertisement
What is wave analysis?
Wave analysis is a method based on the assumption that the market moves according to a specific pattern called a wave. This is a result of the crowd mentality that exists across all markets. There are various advanced wave theories used in market analysis, the most prominent of which is Elliott waves.

Elliott Wave Theory
1. What is the Elliott wave?
Elliott wave theory, developed by Ralph Nelson Elliott in 1930, explains market price movements, shows how market prices fluctuate (following a model now known as Elliott Wave), and describes how stock price movements and consumer behavior can be determined.
This theory became famous in 1935 when Elliott strangely and accurately predicted the bottom of the stock market, from which Elliott Wave became the guideline for thousands of portfolio managers, traders, and private investors.
Ralph Nelson Elliott published his theory of market behavior in his book The Wave Principle in 1938, which was summarized in an article in Financial World magazine in 1939 and extensively described in his last work, Nature’s Laws: The Secret of the Universe in 1946.
In short, Elliott waves are a theory that investors and traders can use in technical analysis. This principle is based on the idea that financial markets tend to follow certain patterns regardless of the time frame. Basically, Elliott Wave Theory (EWT) states that market movements follow a natural circulatory sequence of crowd psychology. The models are created according to the current market sentiment, falling prices, and alternating price increases.
See also: What is Wyckoff? How to invest effectively with the Wyckoff method
2. Basic Elliott wave model
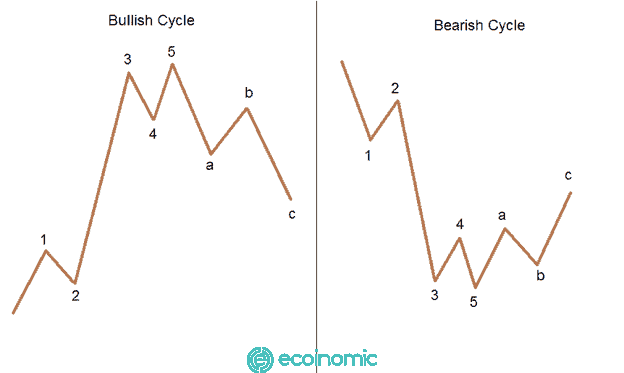
A complete Elliott cycle consists of an impulse wave numbered from 1 to 5 and a correction wave numbered A-B-C; and is divided into 2 bullish and bearish trends: In the uptrend, the Elliott wave cycle has 5 waves of the bullish phase, of which wave 1, wave 3 and wave 5 are bullish waves and waves 2 & 4 are bearish waves.
The remaining 3 wave symbols A, B, and C (the waves in the adjusted wave model) will belong to the reduction phase with A & C waves being decreased waves and wave B being the increasing wave.
In contrast, the Elliott wave cycle in the downtrend has 5 waves of the bearish phase (dynamic wave model) of which wave 1, wave 3 and wave 5 are decreased waves, and waves 2 & 4 are incremental waves. The remaining 3 wave symbols A, B, and C (adjusted wave model) will belong to the increase phase with A & C waves being the increasing wave and wave B being the decreased wave.

Elliott Wave Model Wave 1: This is the first wavelength of the Elliott wave series. Users usually do not make transactions at this wave but will wait for it to form and move to another wavelength. It was then that the Elliott wave model was recognized and calculated the amplitude of the next wavelengths.
Wave 2: The rebound level of wave 2 is at least 23% compared to wave 1, mostly at 50% or 68%. If wave 2 is reduced to 100% compared to wave 1, this is not an Elliott wave and cannot apply Elliott wave theories.
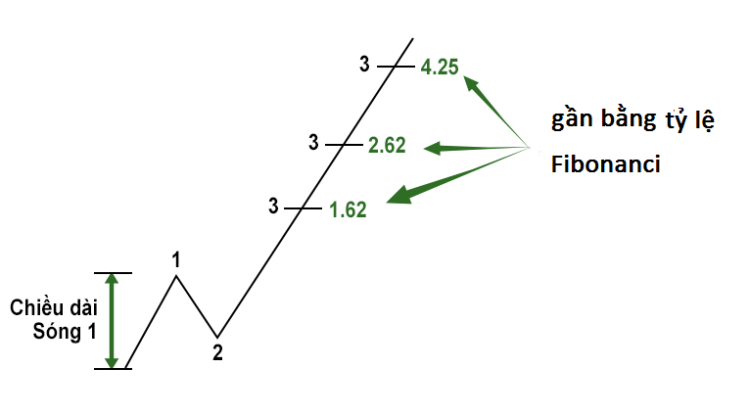
Wave 3: Wave 3 is always higher than or equal to wave 1. If this wave is the largest, then the wave oscillator will tend to coincide with the Fibonacci ratio. That is, about 68% – 134% larger than wave 1.

wave 4: The degree of return of wave 4 is usually between 38% and 61% compared to wave 3. If wave 3 is the largest, wave 4 usually only recovers 23% or 38% compared to wave 3.
Wave 5: This is the most important wavelength of the entire Elliott wave model. Wave 5 is required to have the highest wave peak, the oscillation of the entire model can accurately predict the market trend. Some principles of wave 5 that users can calculate to thoroughly apply Elliott wave theory:
- The length is equal to or equal to 61.8% of wavelength 1;
- Ranges from 38.2% to 61.8% of the total length from wave base 1 to wave peak 3;
- That’s about 161% of wave 3 or 161% of the total length of wave 1 and wave 3 (if wave 5 has the greatest length).
Wave A: The regression level of wave A is usually equal to 38.2% of all previous 5 waves (1, 2, 3, 4, 5). Similar to wave 2, if wave A is reduced to 100% compared to wave 1, this is not an Elliott wave and cannot apply Elliott wave theories.
Wave B: The regression level of wave B is usually at 38.2% – 61.8% of wave A.
Wave C: Usually very short and cannot pass through the endpoint of wave A. Depending on the model (Contracting Triangle or Expanding Triangle), wave C is equal to 61.8% or 161.8% of wave A. However, the minimum length should be 61.8% of wave A.
Calculating the length and proportion of waves in the Elliott wave model is quite complicated, but now there are calculation tools, called wave counters, to give results that are almost absolutely fast and accurate. This helps users look at the results to predict market trends and make accurate trading decisions.
3. Wave levels in Elliott wave theory
- Grand Supercycle: large levels, waves that last for decades, sometimes centuries.
- Supercycle: wave levels that last from several years to several decades (about 40-70 years).
- Cycle: wave levels that last from 1 to several years.
- Primary: Wave levels last from a few months to 2 years.
- Intermediate: the wave level lasts from a few weeks to several months.
- Minor: wave levels that last for several weeks.
- Minute (Quite small): wave level lasts for several days.
- Minuette (Very Small): wave level that lasts for several hours.
- Subminutte (Very small): wave level lasts for several minutes.
In fact, when trading, users do not need to remember the exact names of these waves but just master the knowledge of Elliott wave theory.
4. Principles of Elliott Wave Theory
To apply Elliott waves, investors and traders need to memorize the following three rules:
- Wave 2 is never lower than wave starting point 1.
- Wave 3 is never the shortest of the three waves 1,3,5.
- Wave 4 never reaches the top of wave 1.
5. Apply Elliott wave theory in investment
Elliott waves are not a conventional trading technique so there is no correct method of use or there is specific fixation for placing orders. Elliott waves are considered a long-term prediction tool for determining the most profitable trading orders. For example, the market is being determined at the 1st, 3rd, and 5th wave cycles, focusing on long orders. On the contrary, when the market is in waves 2, 4, A, and C, use short orders or sell assets to take profits.
Conclusion
The effectiveness of Elliott waves is still hotly debated. It has been suggested that the success rate of the Elliott wave principle depends heavily on the trader’s ability to accurately divide market movements into corrective trends and directions.
In fact, waves can be drawn in many ways without necessarily breaking Elliot’s rules. This means that drawing waves correctly is an extremely difficult task, which requires not only practical experience, but also subjectivity.
Therefore, many observers argue that Elliott wave theory is not a legitimate theory due to its highly subjective nature and is based on a loosely defined set of rules. However, there have been thousands of successful investors and traders, earning high returns when applying the principles of the Elliott wave.


