Advertisement
Who is Wyckoff?
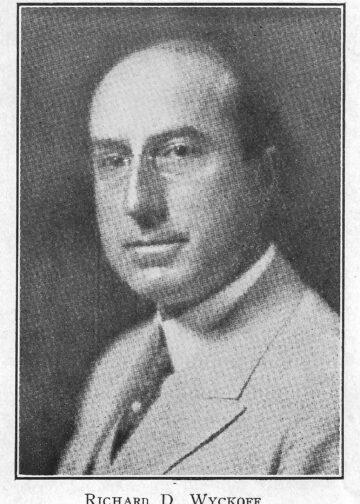
Richard Demille Wyckoff (1873-1934) was one of the pioneers in the study of the stock market using technical analysis from the beginning of the 20th century. In 1888, he began working as an order clerk for a brokerage firm in New York, and at the age of 25, he founded his own brokerage firm. He was the founder, author, and editor of The Wall Street Journal for nearly 20 years.
What is the Wyckoff method?
The Wyckoff Method is a set of trading rules, principles, and methods designed to help users evaluate the entire market, find profitable stocks and identify trading goals. The content includes the following:
- 3 Basic Rules of the Wyckoff Method
- Wyckoff Price Cycle (Wyckoff Price Cycle)
- Wyckoff diagram
- The concept of “Composite man”
- 5 steps to the market
3 Basic Rules of the Wyckoff Method
1.1. The law of supply and demand
The law of supply and demand determines the price. This is the central principle of the Wyckoff method. When demand is greater than supply, the price increases, on the contrary, the price decreases. Based on this rule, investors can study the balance between supply and demand by comparing the corresponding price levels and trading volume.
1.2. The law of cause and effect
The law defines price objectives through assessing the potential level of a particular trend. According to Wyckoff, the accumulation (cause) period will eventually lead to a bullish (consequential) period. Conversely, the distribution phase (cause) will eventually lead to a bearish period (consequential).
1.3. The Law of Effort and Result
The rule gives warnings about the possibility of a trend changing in the near future. The difference between price and trading volume is one of the important signals that the trend can stop or reverse. If asset prices fluctuate in a way that is in harmony with trading volume, it is more likely that the trend will continue. The market trend may continue or change direction if there is a significant difference between the trading volume and the asset price.
See also: What is Dow Theory? Technical Analysis Platform
Wyckoff Price Cycle (Wyckoff Price Cycle)
The price cycle is described from the moment you enter a buy order at the end of the uptrend preparation period (the end of the accumulation period) and from the moment you enter a short position at the end of the downtrend preparation (the end of the price cycle). Distribution phase). The price cycle consists of four stages.
2.1. Accumulation Phase
This is the time when the “big guys” in the market began to accumulate assets. Large amounts of money are deposited from these forces and slowly brought into the market so that prices do not fluctuate significantly. At the accumulation stage, the market tends to level off.
2.2. Bullish Phase
When the market exits the accumulation phase, the bullish phase begins. After holding a sufficient amount of goods and the selling force subsides, buyers quickly push the price up and a new trend is formed. A bull market will encourage people outside the market to buy stocks, which will push demand out of supply and higher prices.
2.3. Distribution Phase
After the need to buy shares is met, profitable investors begin to allocate their assets to those who come later by selling shares for a profit. This period is also skillfully managed by the “big guys”, so the price does not fall too quickly and the market moves quite stably.
2.4. Discount Period
The “big guys” started selling more shares, pushing the market down, other investors sold stocks, oversupply and prices fell. At the end of the bearish period, the market continues its cycle in a new period of accumulation.
Wyckoff diagram in 2 important stages of the price cycle: Accumulation and Distribution
3.1. Wyckoff diagram in the Accumulation phase
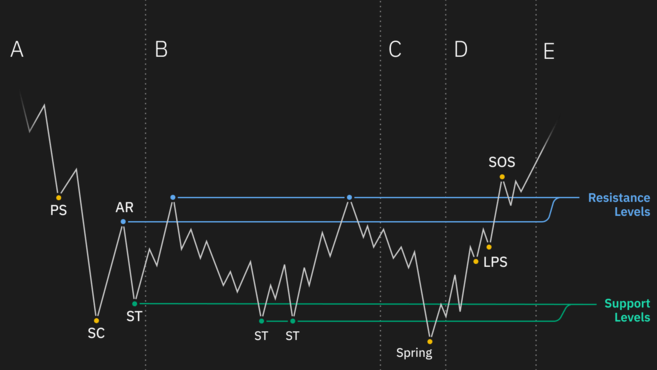
Stage A: Shows the deceleration of the previous downtrend. Here supply still exceeds demand. However, supply is weakening. This is evidenced by the introduction of PS and SC.
Stage B: This is the stage where “cause” is formulated by the law of cause and effect of the Wyckoff method. During this period, key market forces begin to accumulate stocks at low prices to stay ahead of new uptrends. Accumulation can take a long time.
Phase C: This stage runs an important test (Spring) that helps investors determine if their stock price is ready to rise. According to the Wyckoff method, spring success offers investors the opportunity to trade potentially successfully. A small amount of spring indicates that the stock price is ready to rise. This is a good time for investors to place buy orders.
Stage D: Indicates when the price breaks the resistance level of the TR zone and starts a new uptrend. During this stage, pullback, BU or LPs usually occurs before the formation of SOS. These are good points for placing more potential buy orders.
Phase E: This is the period when TR prices are highest and demand is higher than supply. However, new higher TRs can occur at any time during this period but are usually shorter (the re-accumulation phase is similar to the one above). TRs This new move is considered the starting point for price increases.
3.2. Wyckoff diagram in the Distribution phase

Phase A: The market begins to level off due to falling demand. The pre-sale PSY wasn’t enough to stop the uptrend, but it showed strong selling. Then the strong buying power forms a buying peak (Buy ClimaxBC). This is often caused by inexperienced traders and emotional purchases.
Phase B: Distribution acts as an integrated zone (cause) before the market ceiling (outcome). During this period, the rear operator gradually sells the property to meet market demand and reduce demand.
Phase C: In some cases, after the integration phase, the market appears a final bullish trap. This is called UTAD, or post-distribution reliability. It’s basically the opposite of a storage spring.
Stage D: A mirror image of the accumulation phase. The final supply point (LPSY) is usually in the middle of the range and has a lower peak in the chart. From this point on, a new LPSY will be created around or below the support zone. Weakness Signs (SOW) occur when the market is below the support line.
Phase E: Strong overwhelming supply marks the beginning of a downtrend, clearly below the trading range.
See also: What Is a Hammer Candlestick Pattern?
The concept of “Composite man”
“Composite man” are companies that have a significant impact on the market, such as banks, investment companies, lenders, and other financial institutions. According to Wyckoff, all individual market movements and stock movements are the results of complex human influences. They try to manipulate the market and do everything to buy stocks low and sell high.
Once the investor understands the market and enters the same field as Compositeman, Compositeman’s operational strategy will bring high returns to investors. Through regular research and practice, investors can understand the motivations of mixed men from the price behaviors shown on the chart.
5 steps to the market
Step 1: Identify the trend
Trend identification involves identifying current trends and predicting future price directions by analyzing the relationship between market structure and supply and demand. Assessing future trends will help you decide whether to enter the market and where to enter, buy and sell.
Step 2: Trend-oriented stock options
The uptrend is to select stocks that have risen relative to the market, or in other words, against market indices. These are stocks that are highly profitable when the market recovers and are low or still rising when the market corrects.
Step 3: Choose a stock with a minimum “Cause” equal to your price target
Wyckoff’s method determines price targets based on the length of the accumulation/distribution period (if the market moves sideways). In the law of cause and effect, the number of P& F moving horizontally in a trading range (on a point chart & figure) represents a “multiplier” and the next stage of price movement is both short-term and short-term “results”. Long-term business.
Step 4: Determine the mobility of the price
This step focuses on assessing whether the price is outside the TR trading range and ready to rise after accumulation or distribution. Assess the likelihood of price movements.
Step 5: Determine the time to enter the market
Wyckoff believes that in line with the market-wide trend, we only need to enter the market if the elements of each stock meet 3/4 or higher. In addition, the specific principles of the Wyckoff test and the manifestation of price behavior in the TR trading range, help the investor to determine the appropriate entry point, stop loss and take profit.
See also: What is wave analysis? Elliott Wave Theory
Conclusion
Richard D. Wyckoff presented a systematic approach to identifying market trends, selecting industry groups with relative strength relative to the market’s index and strong stocks in that group. Although every method has exceptions, the Wyckoff method has been applied for a long time, experienced many market fluctuations, and is still trusted by investors.


